15 DevTool Secrets for JavaScript Developers
Your browser is no longer a simple visualization tool. Learn 15 secret tools already part of your favorite browser

Web developers spend considerable time using browser DevTools but it’s easy to miss useful tools and techniques when dozens of updates are added every year. The following features are primarily for JavaScript coders using Chrome-based browsers but all developers will discover something useful.
1. Use incognito mode
Incognito or private mode uses a separate user profile and does not retain data such as cookies, localStorage, or cached files between browser restarts. Each session starts in a clean state so it can be ideal for testing login systems, first-load performance, and Progressive Web Apps (PWA). There are a minor restrictions, such as blocking PWA installation, but these are unlikely to cause significant problems during development.
Incognito mode can usually be accessed from the browser menu or right-clicking its desktop icon. Firefox also offers a multi-account container plugin which can be used to set up separate profiles — this can be useful if you want to remain logged into a system using different accounts.
2. Auto-start DevTools
To start development, you normally need to launch your browser (perhaps in incognito mode), open DevTools, and navigate to a local URL. The whole process can be automated in a single click by adding options to the browser launch command.
It’s best to create a new shortcut or script to launch in development mode then, for Google Chrome add:
--incognitoto start in incognito mode--auto-open-devtools-for-tabsto start DevTools- and place the testing URL at the end, e.g.
http://localhost:8000/
On Windows devices, a shortcut could therefore point to:
"C:\Program Files\Google\Chrome\Application\chrome.exe" --incognito --auto-open-devtools-for-tabs http://localhost:8000Other useful Chrome switches include:
--allow-insecure-localhostto ignore SSL errors on localhost domains--disable-extentionsto start without extensions which could possibly affect rendering, e.g. ad blockers--window-size=<width>,<height>to set an initial window size--window-position=<x>,<y>to set an initial window position--user-data-dir="<dir>"to set a user profile directory. Different instances of Chrome can therefore use different user profiles. The directory can be deleted to wipe all previous data.
Many other Chrome options are available.
Similar switches can be added to the Firefox launch shortcut:
-privateto start in private mode-devtoolsto start DevTools- and place the testing URL at the end or after a
-urloption.
3. Use the command palette
Chrome’s DevTools provide and editor-like command palette. From any DevTools panel, press Ctrl | Cmd + Shift + P then search for an option by name:
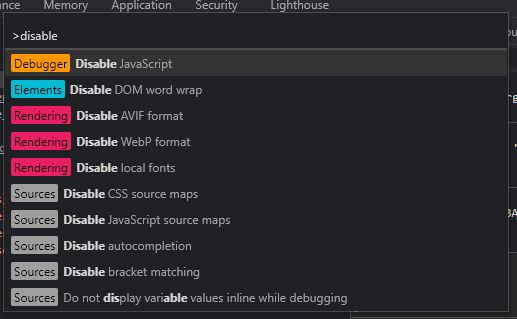
Delete the > prompt to search for a loaded file by its name.
4. Find unused JavaScript
Chrome’s Coverage panel allows you to quickly locate JavaScript (and CSS) code that has — and has not — been used. To start, open Coverage from the More tools sub-menu in the DevTools menu. Reload the page and the panel will show the percentage of unused code with a bar chart:
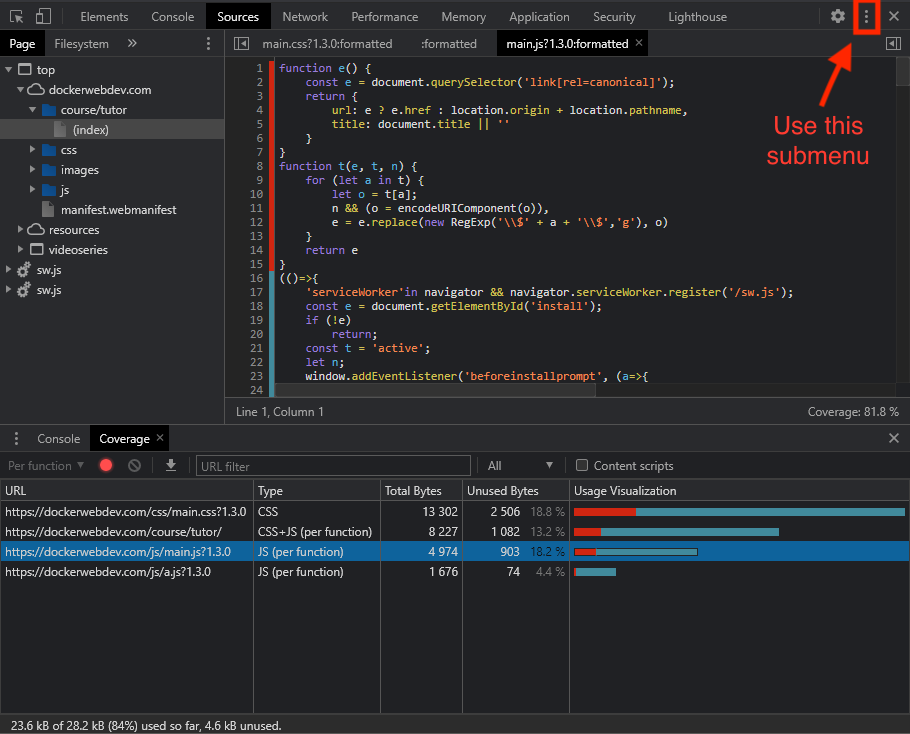
Click any JavaScript file and unused code is highlighted with a red bar in the line number gutter.
If you are testing a Single Page App, you can navigate around and use features to update the unused code indicators. However, be wary that coverage information is reset when you reload or navigate to a new page. This is a great tool to understand how much of an external depednencies are you using in your code, if you’re importing a 100kb library and only using 1% of it, you’ll clearly see it here too.
5. Locate DOM-changing code
It can be difficult to determine which function is responsible for updating a specific HTML DOM element when an event occurs. To locate a process, right-click any HTML element in the Elements panel and select one of the options from the Break on sub-menu:
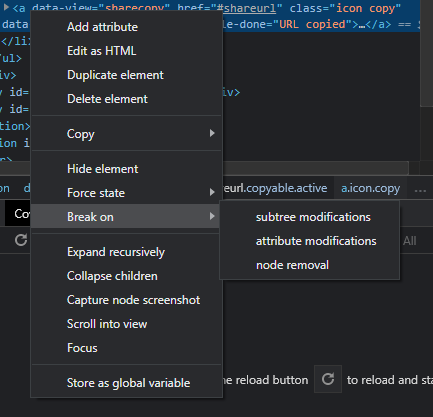
Choose:
- subtree modifications to monitor when the element or any child element is changed
- attribute modifications to monitor when the element’s attributes, such as
class, are changed, or - node removal to monitor when the element is removed from the DOM.
A breakpoint is automatically activated in the Sources panel when such an event occurs.
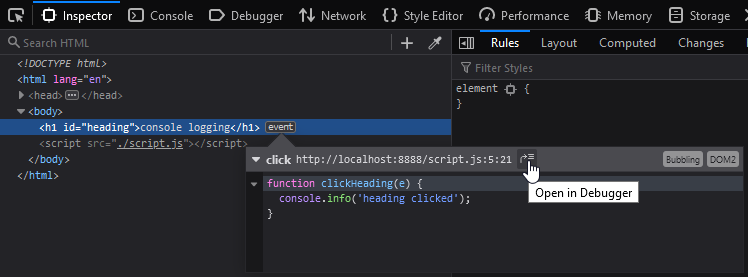
Firefox DevTools offer an identical feature in the Inspector pane. In addition, Firefox indicates which DOM nodes have handlers attached with an event icon. This can be clicked to view more information, expand the handler function, or open it in the debugger:
6. Throttle network speed
Testing your site using a high-end PC on a fast and reliable network may not be indicative of real-world usage. Your users could have an unreliable mobile connection or be connected to overloaded airport wi-fi.
The Network tab offers a throttling option which can artificially slow down HTTP upload speeds, download speeds, and latency (an additional delay in the connection or response). This can help identify the cause of performance bottlenecks:
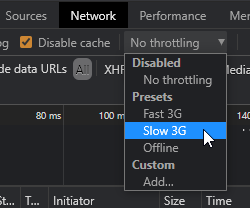
Chrome-based browsers allow you to add your own Custom network profiles.
7. Filter network requests
The DevTools Network panel offers several filters including a JS button to only show JavaScript requests. The filter search box can find requests when you enter part of a URL, but it also accepts special commands including:
- filter cached requests with
is:cached - filter incomplete requests with
is:running - identify large requests by entering
larger-than:<S>, where<S>is a size in bytes (1000000), kilobytes (1000k), or megabytes (1M), or - identify third-party resources by entering
-domain:<yourdomain>. Your domain can use wildcard characters such as*.
8. Blackbox scripts and lines
Sometimes it’s not necessary to know exactly how, when, or where a JavaScript error occurs. It’s usually futile trying to debug problems in libraries (React, Vue.js, jQuery, etc.) or third-party scripts (analytics, social media widgets, chat bots, etc.) which you cannot easily change.
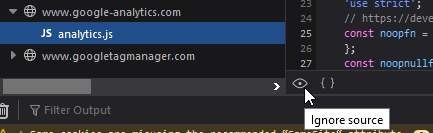
DevTools allow scripts to be blackboxed so they will never open in the debugger even when you choose to step into one of its functions. To blackbox a file in Firefox, open a file in the Debugger panel and click the ignore source eye icon:
In the Chrome DevTools Sources panel, open a file, right-click somewhere in the code, and choose Add script to ignore list. You can also blackbox individual statements by right-clicking the number gutter and choosing Never pause here from the menu.
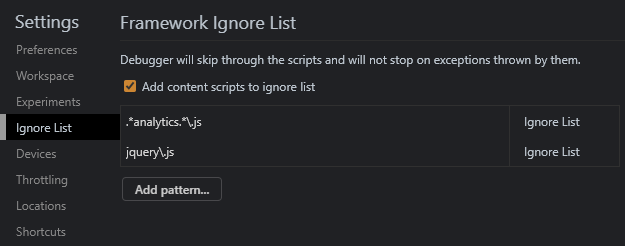
Alternatively, click the settings cog icon or press F1 to access the Settings, then switch to the Ignore List tab. Check Add content scripts to ignore list and enter any number of file name patterns using a regular expression such as jquery.*\.js:
9. Use logpoints
It’s tempting to liberally insert console.log() debugging statements throughout your files but logpoints provide a way to obtain the same information without writing any code.
To add a log point, open a script in the Sources panel (or Debugger panel in Firefox), right-click any line number, and choose Add log point…. Enter an expression such as one you would use in a console command, e.g.
"The value of x is", xThe message will appear in the DevTools console whenever that line is executed. Log points will usually persist between page refreshes.
10. Use conditional breakpoints
Clicking a line number of a file opened in the Sources panel (or Debugger panel in Firefox) adds a breakpoint. It halts a script at that point during execution so you can step through code to inspect variables, the call stack, etc.
Breakpoints are not always practical, e.g. if an error occurs during the last iteration of a loop which runs 1,000 times. A conditional breakpoint however, can be set so it will only trigger when a certain condition is met, e.g. i > 999. To set one, right-click a line number, choose Add conditional breakpoint…, and enter a condition expression.
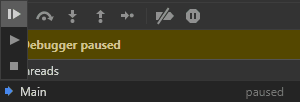
11. Halt infinite loops
It’s easy to trigger an infinite loop which causes browser processes to become overwhelmed. Despite many years experience, I recently caused one by accidentally reversing the expressions in a JavaScript for loop so it never ended!
To stop an infinite loop in Chrome DevTools, open the Sources panel and click the debugging pause icon to stop the script. Hold down the same icon and choose the square stop icon to discontinue script processing.
12. Re-run Ajax requests
A browser JavaScript Ajax call requests data from a remote server typically using the Fetch or XMLHttpRequest APIs. These are shown in the DevTools Network panel and can filtered using the XHR button.
DevTools shows lots of information but it’s sometimes practical to re-run an Ajax call and analyse the results in another tool. Right-click any request, then choose an option from the Copy sub-menu:
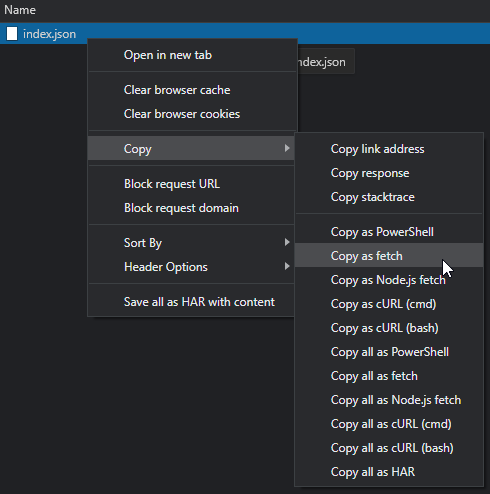
Options include copying as a command for Windows Powershell, cURL, and the JavaScript Fetch syntax (this could be useful for pasting into project code as a starting point for further Ajax calls).
Open Source Session Replay
OpenReplay is an open-source, session replay suite that lets you see what users do on your web app, helping you troubleshoot issues faster. OpenReplay is self-hosted for full control over your data.
Start enjoying your debugging experience - start using OpenReplay for free.
13. Enable local file overrides
Chrome allows any HTTP request to use a local file on your device rather than fetch it over the network. This could allow you to:
- edit scripts or styles on a live site without requiring build tools
- develop a site offline which normally requests essential files from a third-party, or domain
- temporarily replace an unnecessary script such as analytics.
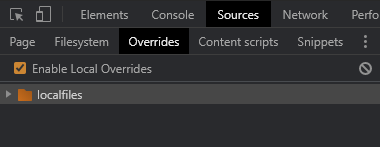
Create a directory on your local PC where overrides files will be stored, e.g. localfiles, then open Chrome’s DevTools Sources panel. Open the Overrides tab in the left-hand pane, click + Select folder for overrides, and choose the directory you created. You’ll be prompted to Allow files to be saved locally and the directory will appear:
Now open the Page tab and locate any source file. There are two ways to add it as a local override:
- right-click the file and choose Save for overrides, or
- open the file, make an edit, and save it with Ctrl | Cmd + S.
The file icon is shown with a purple overrides indicator:
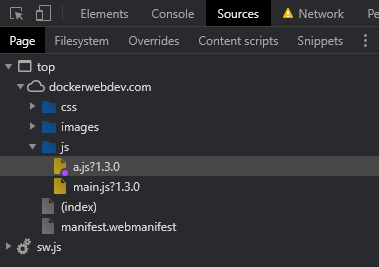
It will also be present in the Overrides tab and the localfiles directory. The file can be edited within Chrome or using any code editor — the updated version is used whenever the page is loaded again.
14. Manage client-side storage
Web pages can store data on the client using a variety of techniques. The Application panel in Chrome DevTools (or Storage panel in Firefox) allows you to add, examine, modify, and delete values held in cookies, cache storage, localStorage, sessionStorage, IndexedDB, and Web SQL (where supported).
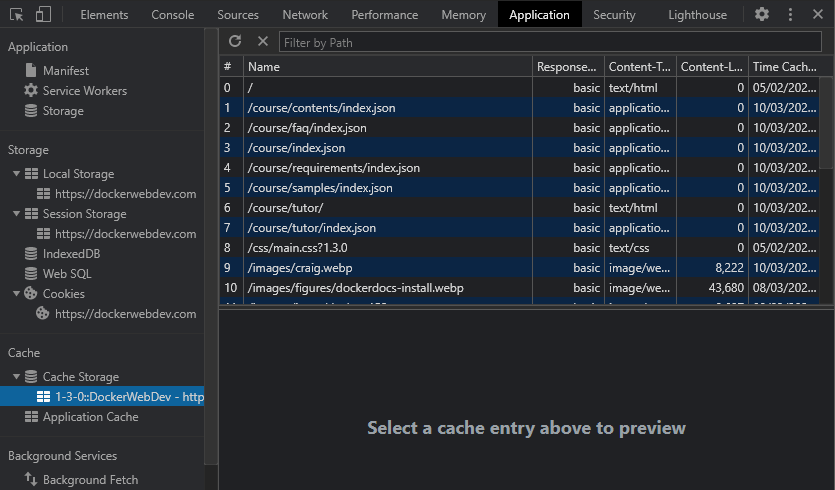
The Storage tab in Chrome shows how much data is being stored locally and provides a quick Clear site data option.
15. Emulate mobile hardware
Smart phones and tablets often include hardware such as Global Positioning Systems (GPS), gyroscopes, and accelerometers. These are not normally available in desktop PCs which can make development using APIs such as geolocation more difficult.
Chrome can emulate device hardware in DevTools — choose Sensors from the More tools menu:
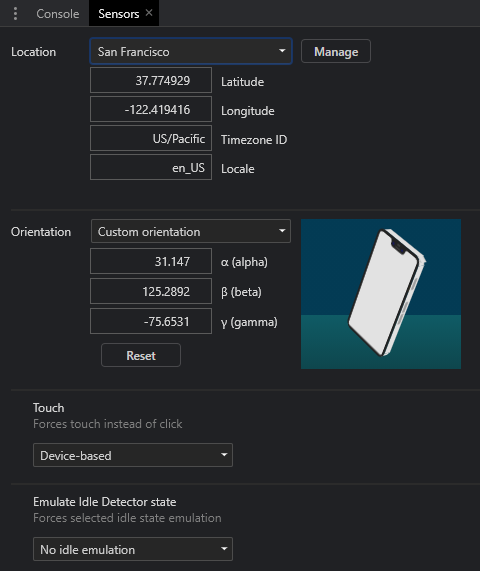
Several options are available:
- select a major city or enter a custom latitude and longitude. The location can also be set to unavailable to emulate how your application responds when a GPS signal fails.
- set the device orientation using a preset or custom metrics. You can click and drag the smartphone to rotate around the x any y axis, or hold down Shift to rotate around the z axis.
- force touch rather than mouse or other native device events, and
- set the idle state to examine how you app responds to the lock screen.
DevTool dedication
Browser DevTools have evolved from basic JavaScript logging to a comprehensive development and debugging environments. They can look complex but, with a little experimentation, you’ll discover features which can save hours of coding effort.