Building Interactive Dashboards with Strapi, Node and Next
Combine several tools to build interactive dashboards


The introduction of interactive dashboards when building applications has made data sharing, flexibility, and customization more efficient. Some key benefits of interactive dashboards include insight into action, visualization, real-time, and mobile friendliness. The combination of Strapi, Node.js, and Next.js provides a powerful stack for developing these dashboards, and this article will show how to combine the three tools to create interactive dashboards.

Discover how at OpenReplay.com.
Before we dive right into the development process, let’s understand the technologies involved:
-
Strapi: This is an open-source headless CMS (Content Management System) that allows you to easily create and manage content by building customizable APIs. It will serve as our data management layer.
-
Node.js: This is a JavaScript runtime for executing server-side JavaScript code, that was built on Chrome’s V8 engine. It’s basic for both Strapi and Next.js and will serve as the environment in which our server-side code will run.
-
Next.js: This React framework provides server-side rendering and static site generation, offering a streamlined way to build dynamic web applications.
Setting up the Project
The first step in building interactive dashboards using Strapi, Node.js, and Next.js is to install the pre-requisites. This tutorial uses Strapi’s v4.10.x version. In your terminal, input the following code:
npm install strapi -g
strapi new dashboard-backend –quickstart
The above command will install Strapi globally and create a new project.
You can simply create a basic server in Node.js by doing this:
const express = require("express");
const app = express();
const port = 3000;
app.get("/", (req, res) => res.send("Hello World!"));
app.listen(port, () => console.log(`Server running on port ${port}`));
The output in the console will be “Server running on port 3000,” indicating that the server has successfully started and is listening on port 3000.
Click here if you don’t have Node.js and npm installed already.
Finally, create a Next.js Application for Frontend. To do this, input the following code in your terminal:
npx create-next-app dashboard-frontend
cd dashboard-frontend
npm run dev
We are ready!
Designing Interactive Dashboards
To successfully design our interactive dashboard, let’s explore Strapi’s data organization with practical examples.
Using Strapi for Data Organization
Define the necessary content types in Strapi for your data, like products, sales, users, etc. To achieve this, open the Strapi Admin Panel and register your details (check out the image below) to create and manage content types.
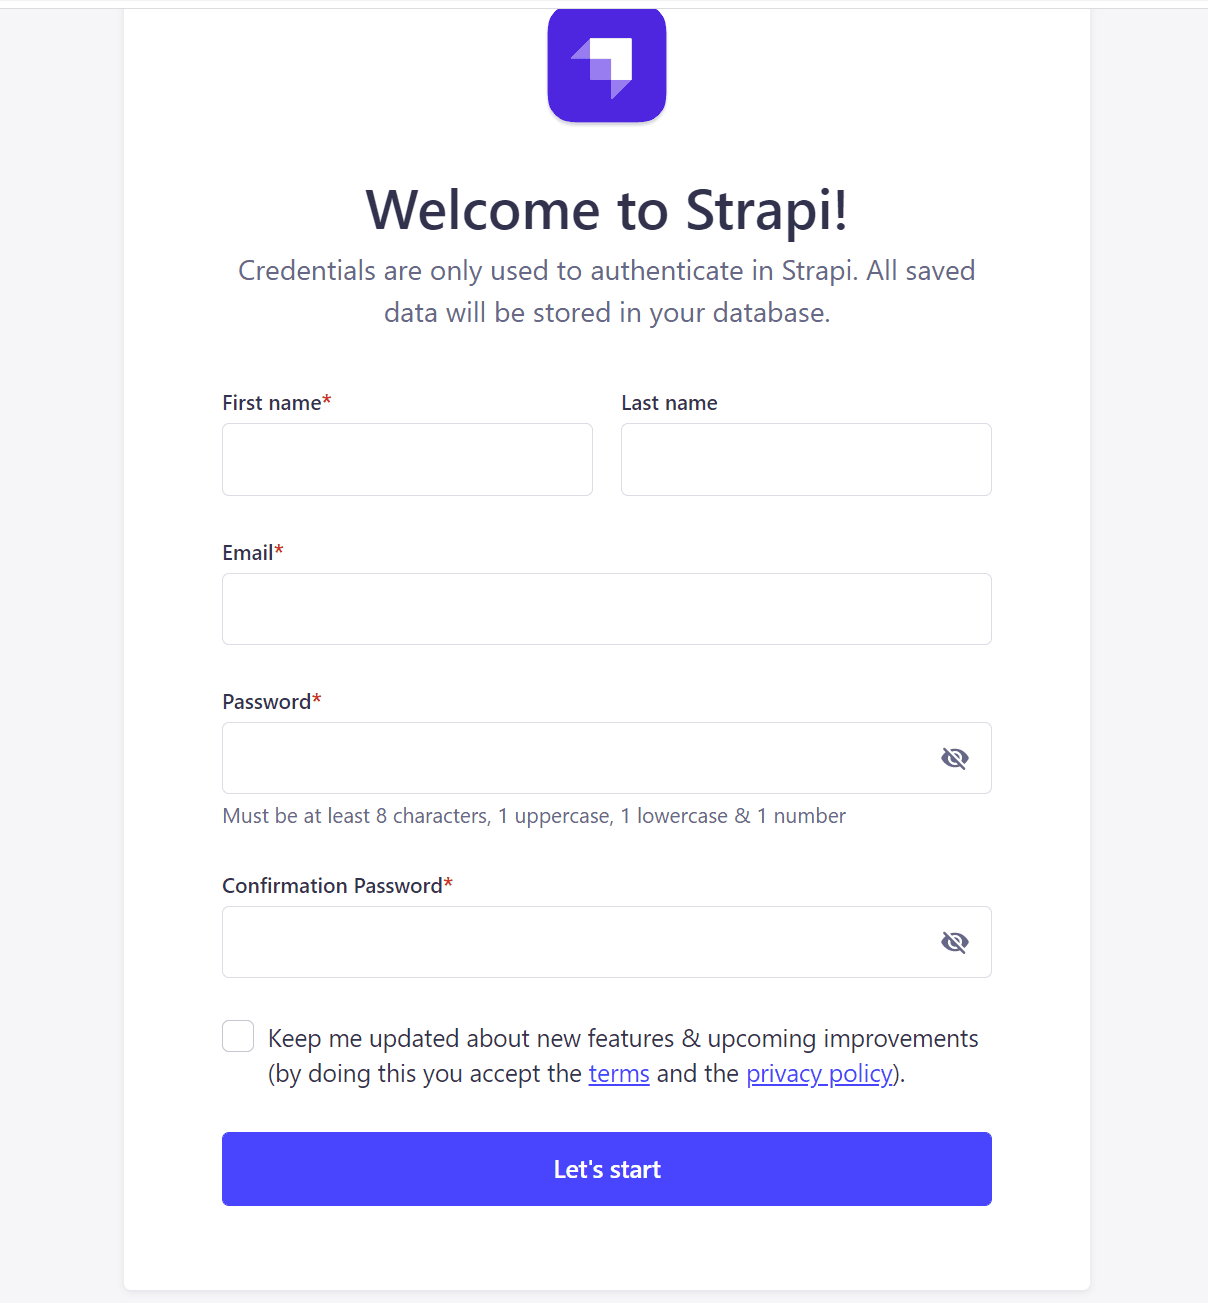
After registering your admin user, you should see the Strapi Dashboard in your browser:
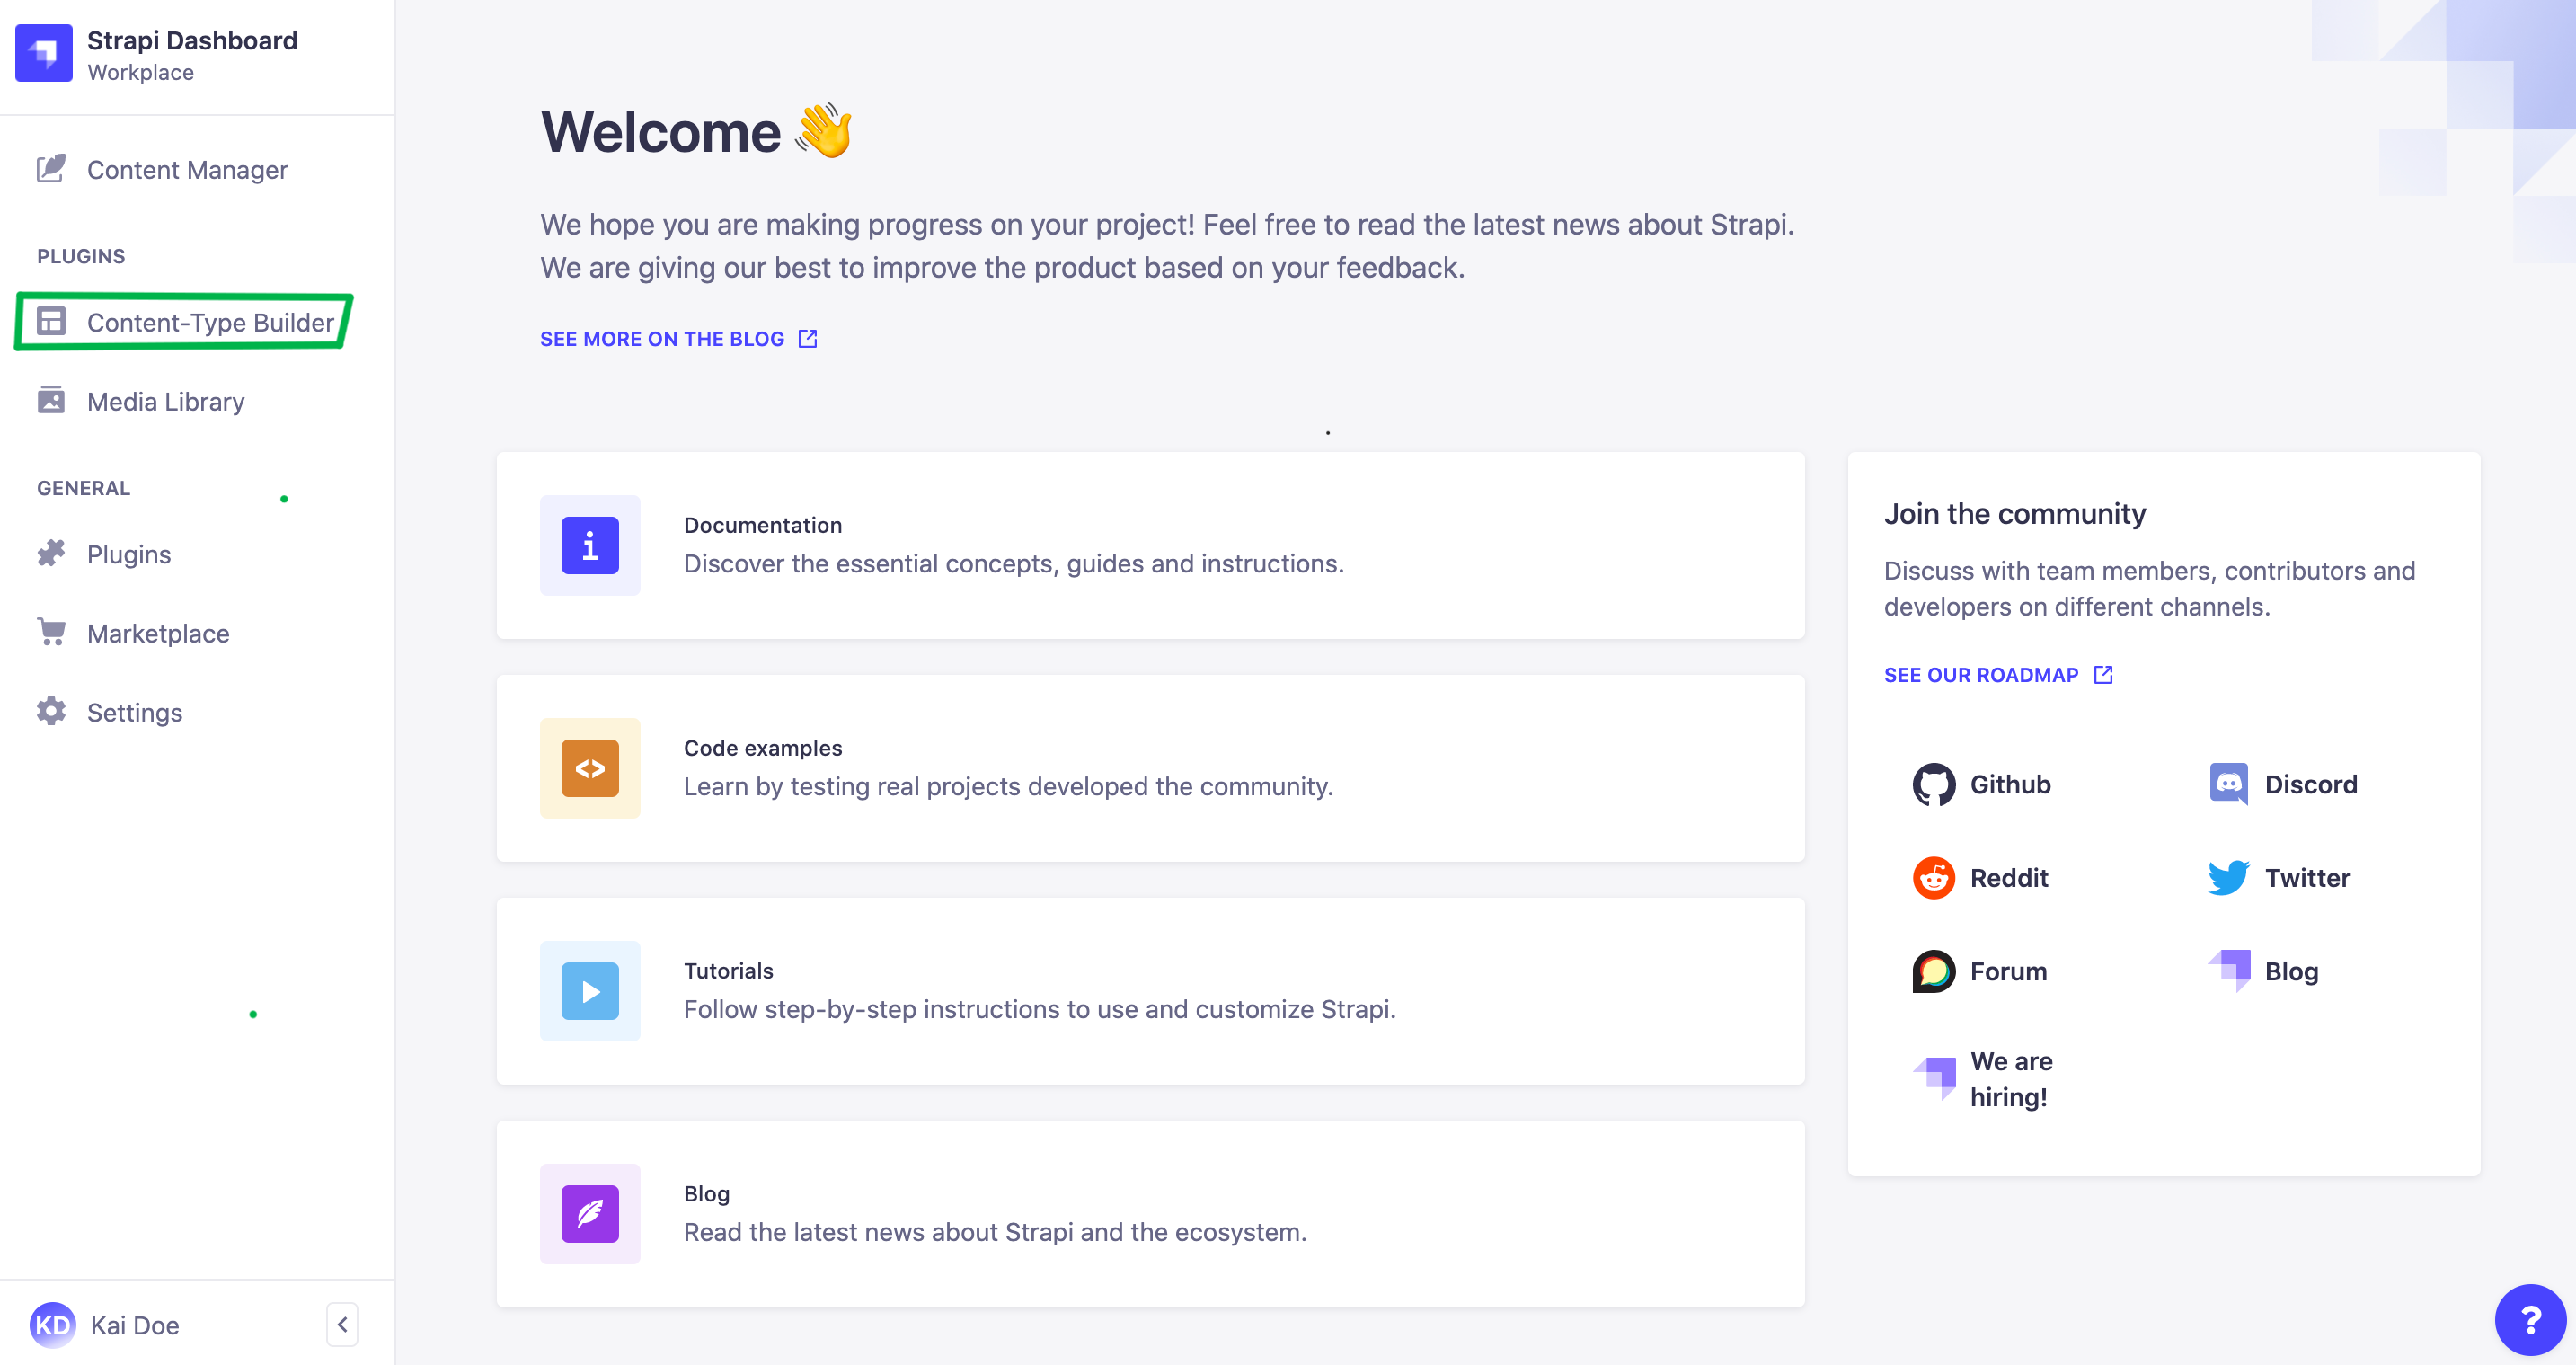
Navigate to ‘content type builder’ on the left side of your Strapi dashboard. You will be directed to the image below;
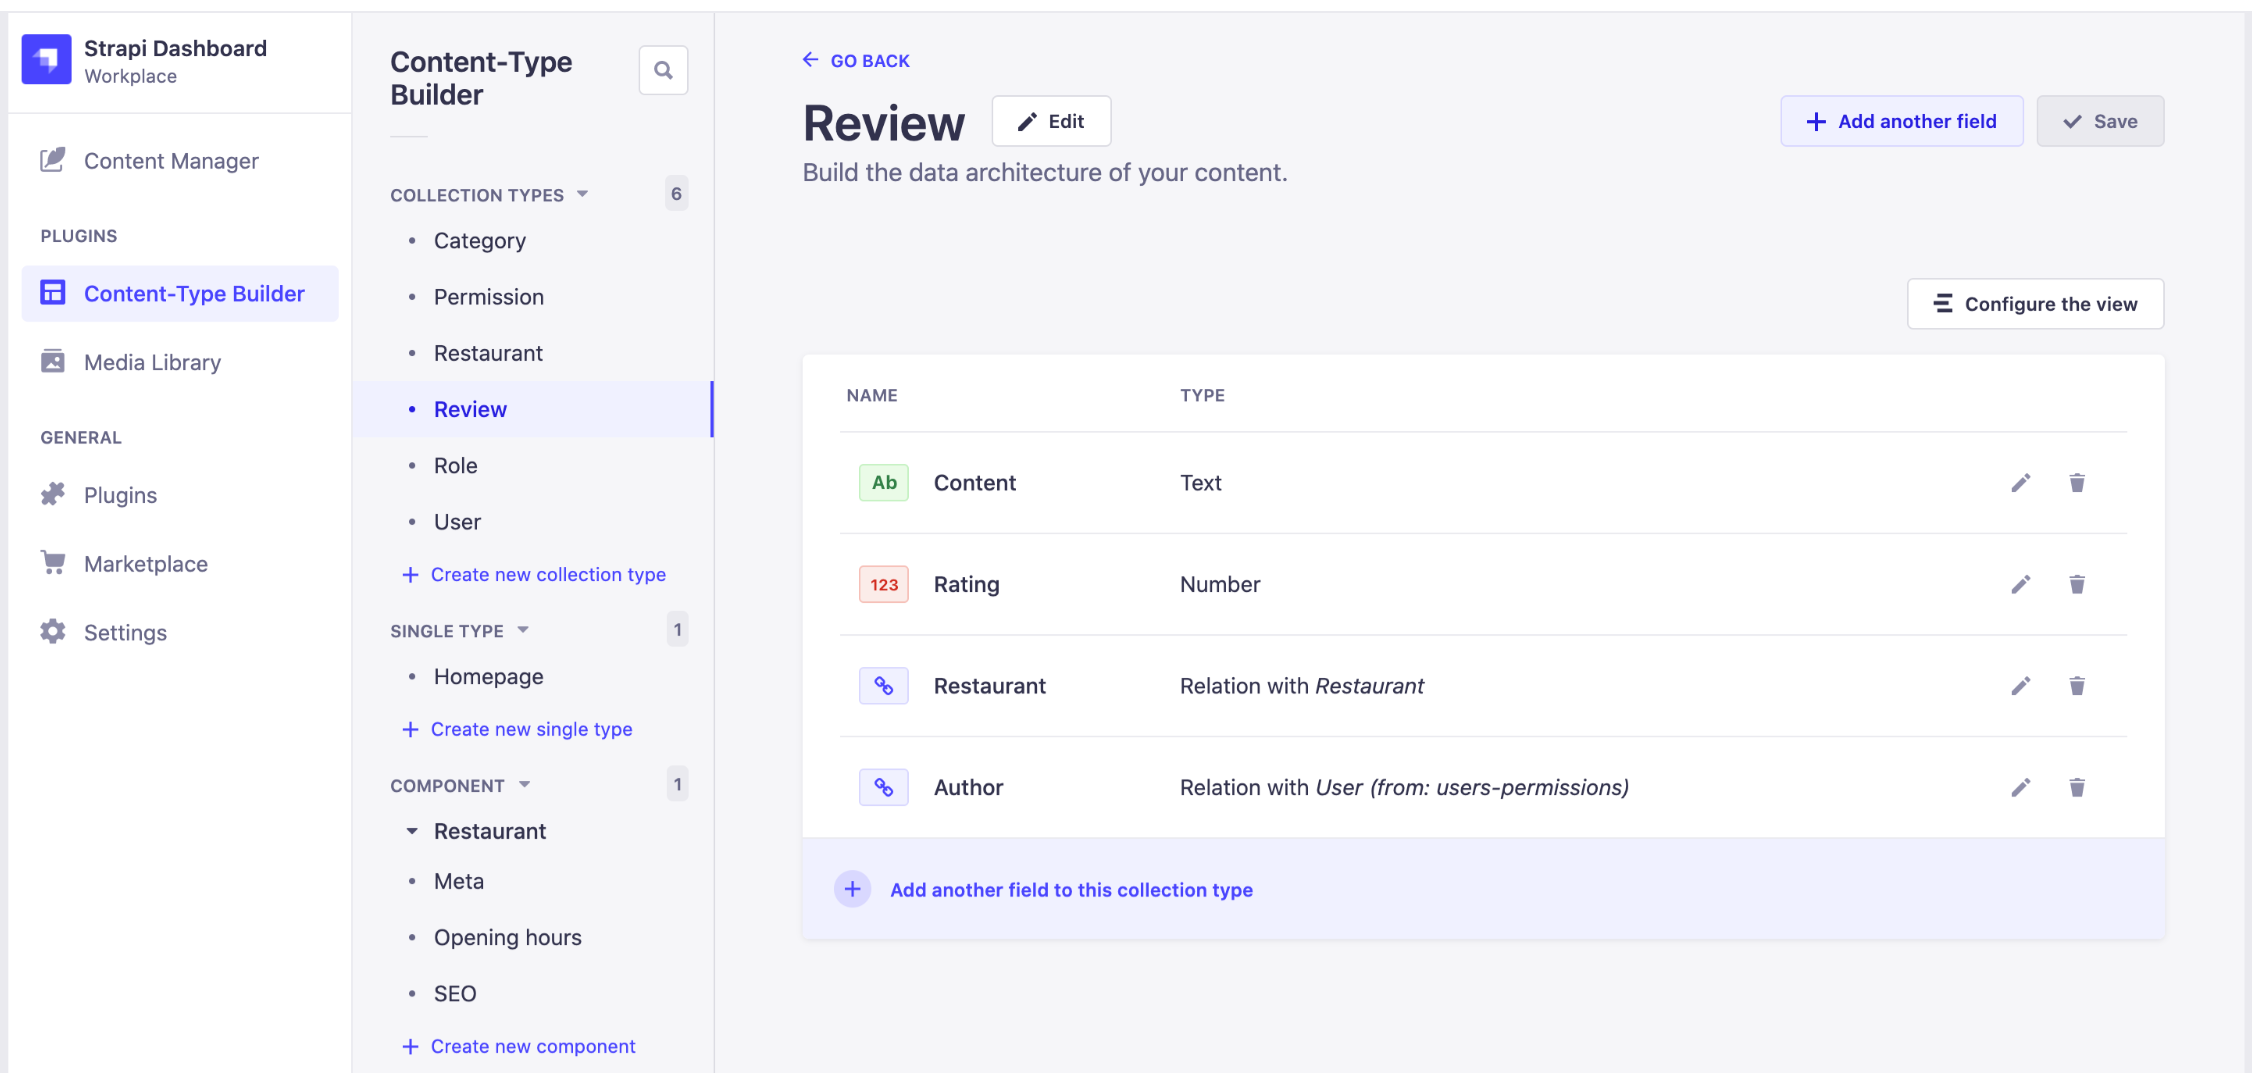
For a sales dashboard, create types like “Sales,” “Products,” and “Customers.”.
Example: Creating a “Sales Data” Content-Type
-
First, Access the Strapi Admin Panel: Navigate to http://localhost:1337/admin and log in.
-
Then, create a new content type by clicking “Content-Type Builder” in the sidebar, then “Create new collection type.”.
-
Finally, name your content type (e.g., sales data) and add fields. For a sales data type, you might include fields like date, total_sales, number_of_transactions, etc. Strapi provides various field types like Text, Number, Date, relationship, etc. Check out this quick guide.
-
Once you’ve added the fields your dashboard needs, save the content and make it available.
Adding Data to Strapi
Once the content type is available, you can now start adding data:
-
In the Strapi admin panel, locate your new content type on the sidebar and click on it. Then click on “Add New [Content Type]” and fill in the required fields with your data.
-
Since we are using a Sales Dashboard as an example, add your data manually. For instance, date: 2024-01-01, total_sales: 5000, number_of_transactions: 35
-
Click ‘Save’ to store this data in Strapi’s backend. (You can use this manual method to input as much data as you want in your dashboard.)
Retrieving the Data from Strapi in Your Dashboard
To display the data (inputted above) on your dashboard, we’ll need to get it from Strapi’s API.
In our Next.js application, we can retrieve this data using fetch in the getServerSideProps function, like this:
export async function getServerSideProps() {
  // Fetching data from Strapi
  const res = await fetch("http://localhost:1337/sales-data");
  const salesData = await res.json();

  return { props: { salesData } };
}

// In your component
const Dashboard = ({ salesData }) => {
  // Render your sales data in the dashboard
  return (
    <div>
      {salesData.map((data) => (
        <div key={data.id}>
          <p>Date: {data.date}</p>
          <p>Total Sales: {data.total_sales}</p>
          <p>Transactions: {data.number_of_transactions}</p>
        </div>
      ))}
    </div>
  );
};
Depending on the number of data you inputted, your rendered Sales Dashboard would have the following code:
<div>
  <div>
    <p>Date: 2024-01-09</p>
    <p>Total Sales: 1000</p>
    <p>Transactions: 5</p>
  </div>
  <div>
    <p>Date: 2024-01-10</p>
    <p>Total Sales: 1500</p>
    <p>Transactions: 8</p>
  </div>
  {/* ... more sales data divs */}
</div>;
Implementing Interactive Features in Next.js
Implementing interactive features in a Next.js dashboard when using data fetched from a Strapi backend involves enhancing the user interface with responsive elements that react to user inputs or interactions. Some common interactive features to add are how to filter and sort data.
Filtering data
For instance, if you want to filter the sales data by date or sales amount. You can add input fields for users to enter their filter criteria.
- First, add state hooks for your filter inputs:
import React, { useState } from "react";

const Dashboard = ({ salesData }) => {
  const [filterDate, setFilterDate] = useState("");
  const [filterSales, setFilterSales] = useState("");

  // ... Rest of the component
};- Implement a function to handle data filtering:
const filteredData = salesData.filter((data) => {
 return (
   (filterDate ? data.date.includes(filterDate) : true) &&
   (filterSales ? data.total_sales >= filterSales : true)
 );
});

// ... Rest of the component- Add inputs for filtering;
const Dashboard = ({ salesData }) => {
  const [filterDate, setFilterDate] = useState("");
  const [filterSales, setFilterSales] = useState("");

  const filteredData = salesData.filter((data) => {
    return (
      (filterDate ? data.date.includes(filterDate) : true) &&
      (filterSales ? data.total_sales >= filterSales : true)
    );
  });

  return (
    <div>
      <input
        type="date"
        value={filterDate}
        onChange={(e) => setFilterDate(e.target.value)}
        placeholder="Filter by Date"
      />
      <input
        type="number"
        value={filterSales}
        onChange={(e) => setFilterSales(e.target.value)}
        placeholder="Minimum Sales"
      />

      {filteredData.map((data) => (
        <div key={data.id}>{/* ... Your data presentation here */}</div>
      ))}
    </div>
  );
};
Output:
const salesData = [
  { id: 1, date: "2024-01-09", total_sales: 1000, number_of_transactions: 5 },
  { id: 2, date: "2024-01-10", total_sales: 1500, number_of_transactions: 8 },
  { id: 3, date: "2024-01-11", total_sales: 800, number_of_transactions: 4 },
  // Add more data as needed
];Connecting the Backend and Frontend
This is where we connect the backend (Strapi) with the frontend (Next.js) to display and interact with the data on our dashboard.
- First, we set up Strapi API Endpoints. For our sales dashboard, the endpoints are
/sales,/products, etc. - We’ll configure Cross-Origin Resource Sharing (CORS) in Strapi: Open the middleware.js file in your Strapi project (create one in the config folder if it doesn’t exist).
- Add or update the CORS configuration.
module.exports = {
  //...
  settings: {
    cors: {
      enabled: true,
      origin: ["http://localhost:3000"], // URL of your Next.js app
    },
    //...
  },
};- Finally, we fetch the data using methods like
getStaticProps,getServerSideProps, or a React hook likeuseEffect.
export async function getServerSideProps() {
  // Fetching sales data from Strapi

  const res = await fetch("http://localhost:1337/sales"); // Adjust the URL or port as needed
  const salesData = await res.json();

  return { props: { salesData } };
}

const Dashboard = ({ salesData }) => {
  // Render your sales data in the dashboard
  //...
};
Establishing Communication Between Strapi and Node.js
To establish this Strapi-Node connection, we will import the necessary modules, create an Express.js app, define the route for processing sales data, and export the Next.js with getServerSideProps. See below:
// Import necessary modules
const fetch = require("node-fetch");
const express = require("express");
const next = require("next");

// Create an Express.js app
const app = express();
const port = 3001;

// Define the route for processing sales data
app.get("/process-sales-data", async (req, res) => {
  try {
    const strapiResponse = await fetch("http://localhost:1337/sales");
    const salesData = await strapiResponse.json();

    // Process the salesData here
    const processedData = processSalesData(salesData);

    res.json(processedData);
  } catch (error) {
    res.status(500).json({ message: error.message });
  }
});

// Start the Express.js server
app.listen(port, () => {
  console.log(`Server is running on http://localhost:${port}`);
});

// Function to process sales data
function processSalesData(data) {
  // Implement your data processing logic
  return data; // Return processed data
}

// Export the Next.js page with getServerSideProps
module.exports = async function ({}) {
  const dev = process.env.NODE_ENV !== "production";
  const nextApp = next({ dev });
  const handle = nextApp.getRequestHandler();

  await nextApp.prepare();

  app.get("*", (req, res) => {
    return handle(req, res);
  });

  await app.listen(port);

  console.log(`Next.js server is running on http://localhost:${port}`);

  // Return an empty object as getServerSideProps requires a return value
  return {};
};
The processed data is sent back to the user as a JSON response when they access http://localhost:3001/process-sales-data.
Implementing User Authentication
To implement user authentication, we’ll introduce JSON Web Tokens in Strapi and Next.js:
In Strapi:
- Go to Plugins
- Users & Permissions
- Settings
- JWT settings
While in Next.js, use context or hooks to manage the authentication state.
Deployment and Optimization
For Strapi, use platforms like Heroku to deploy the application, and for Next.js, you can deploy on Vercel or Netlify.
To optimize performance, enable code splitting.
import dynamic from "next/dynamic";
const DynamicComponent = dynamic(
  () => import("../components/DynamicComponent"),
);
import dynamic from "next/dynamic"; - This line imports the dynamic function from Next.js, which is used for dynamic imports.const DynamicComponent = dynamic(() => import("../components/DynamicComponent"));- This line creates a dynamic component namedDynamicComponent. The component is now imported from the path../components/DynamicComponent.
Summary
In this article, we looked at the following:
- Setup: Installing and configuring Strapi, Node.js, and Next.js.
- Dashboard Design: Creating content types in Strapi, fetching and displaying data in Next.js.
- Interactivity: Adding filters in our Next.js application.
- Backend-to-Frontend Integration: Configuring Strapi API endpoints and CORS, establishing Node.js-Strapi communication.
- Authentication: Using JSON Web Tokens in Strapi and context/hooks in Next.js.
- Deployment: Using Heroku for Strapi and Vercel/Netlify for Next.js; optimizing with dynamic imports.
Happy Building!
Resources
Explore the lists of resources for this article below:
- https://strapi.io/blog/build-a-blog-with-next-react-js-strapi
- https://chartbrew.com/blog/create-your-strapi-visualization-dashboard-with-chartbrew/
- https://docs.strapi.io/dev-docs/quick-start
- https://docs.npmjs.com/downloading-and-installing-node-js-and-npm