
Creating Flowcharts to Enhance Workflows with AI

The realm of front-end development is ever-evolving, with new tools and methodologies emerging to streamline processes. This article delves into enhancing the front-end development workflow through innovative tools and AI assistance for the faster and more efficient development of web applications. It illuminates how developers can harness the power of flowcharts and Mermaid.js to streamline the workflow of applications. By integrating these tools, developers can simplify complex processes, foster better communication, and reduce the time spent on project planning.

Discover how at OpenReplay.com.
A flowchart acts as a visual representation of a system workflow, which is invaluable in planning and communication. It provides a clear and concise way to depict the sequence of steps in a process, making it easier for developers and clients to understand complex operations and decision-making pathways.
With the aid of flowcharts, web developers can delineate how each process interlinks, paving the way for a streamlined and more effective approach to project development.
The essence of a flowchart lies in three fundamental elements:
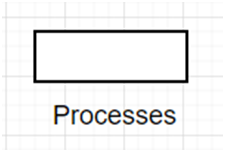
- Rectangle: This symbol represents a process step or action. Each rectangle in a flowchart is a task or operation that needs to be performed as part of the overall process.
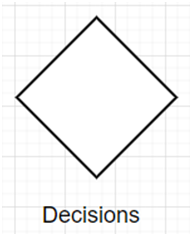
- Diamond: This shape is an element that denotes a decision point within the flowchart. It usually contains a question or condition that leads to two or more outcomes, branching the flow into two or more different directions based on the answer or outcome of the condition.
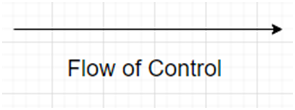
- Arrow: Arrows indicate the directional flow of the process. They connect different symbols and show sequential steps and actions.
Understanding these fundamentals is crucial because it forms a comprehensive and visual narrative of a system workflow.
Exploring Mermaid.js
Mermaid.js is a lightweight JavaScript-based diagramming and charting tool that simplifies the creation of diagrams and flowcharts through text syntax.
It integrates seamlessly into development environments, allowing developers to maintain documentation alongside code. The significance of Mermaid.js lies in its ability to turn text-based instructions into visually appealing and interactive diagrams, enhancing the readability and accessibility of development workflows.
Leveraging ChatGPT
Integrating AI, particularly ChatGPT, into the flowchart creation process can drastically reduce the time and effort needed to produce detailed diagrams. Creating flowcharts can be stressful when designing systems with highly complex activities.
The ability of ChatGPT to understand and translate requirements into flowchart elements means that developers can quickly generate a visual outline of a project structure in Mermaid.js. This allows for more time to be spent on actual development and less on planning phases.
Getting Started with Mermaid.js
Embarking on the journey with Mermaid.js is a step towards simplifying the visualization of complex information. It is designed to be accessible, even for those new to diagramming. To effectively utilize Mermaid.js, it is essential to comprehend its syntax foundation and its application in generating efficient diagrams. The core concepts revolve around its simple syntax that resembles markdown, making it easy to learn and produce detailed flowcharts. To master Mermaid.js, one must familiarize themselves with its basic structure, which includes defining diagram types, setting up nodes, and connecting them with appropriate relationships.
Visualizing Code Manually
Mermaid.js shines when transitioning from syntax to a rendered diagram. Developers can manually write code in the Mermaid.js syntax and see their text-based diagrams come to life with the help of software such as draw.io. This immediate visual feedback loop is invaluable for ensuring accuracy and efficiency in diagram creation.
Below is an example of Mermaid.js syntax for a simple flowchart and how it translates into a diagram:
graph LR
    A[Start] --> B{Is it sunny?}
    B -- Yes --> C[Go outside]
    B -- No --> D[Stay inside]
    C --> E[Play football]
    D --> F[Read a book]
    E --> G[End]
    F --> G
When rendered, this code will produce a flowchart that starts at Start, which leads to a decision Is it sunny?, and branches to either Go outside or Stay inside with subsequent actions leading to the End.
-
graph LR: This declares the orientation of the graph.LRmeans left to right. Other options include RL (right to left), TB (top to bottom), and BT (bottom to top). -
A[Start]: This creates a node labeledStart. The letter A is an identifier for the node, and [ ] represents a process node that denotes the shape of the node represented as a rectangle by default. -
-->: This connects two nodes, indicating the direction from one node to another. -
B{Is it sunny?}: This creates a decision node with the labelIs it sunny?. The curly braces indicate that it is a diamond-shaped node, typically used for decision points. -
B -- Yes --> C[Go outside]: This shows a flow from the decision node B to the process node C with the labelGo outside.The line-- Yes -->indicates the condition under which the flow proceeds in this direction. -
C --> E[Play football]: This connects theGo outsidenode to thePlay footballnode, showing the next step in the flow. -
D[Stay inside]: This is another process node with the labelStay inside, connected to the decision node B. -
E --> G[End]andF --> G: Both thePlay footballandRead a booknodes lead to theEndnode, concluding the flowchart.
Each node and connection is written on a new line, making the code easy to read and maintain. The simplicity of the syntax allows for quick modifications and updates to the flowchart as the project evolves.
The above code produces the following flowchart:
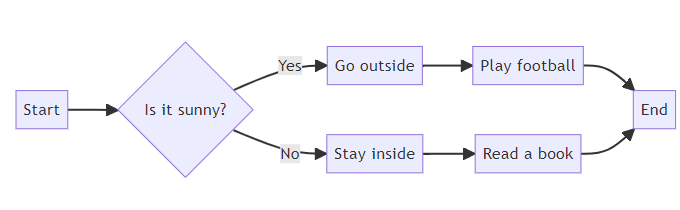
In the flowchart above, notice that all three elements are displayed. The diamond, Is it sunny?, produces two outcomes, yes or no, as seen and depicts decisions. If it is sunny, go outside and play football. Else, stay inside and read a book. The arrows show the flow of processes. Each process is enclosed in a rectangle. These shows how flowcharts can be easily obtained by manually writing Mermaid.js code.
Designing Flowcharts with ChatGPT and Mermaid.js
Manually creating codes for large applications can be a lot of work. The diagram above illustrates a simple flowchart with Mermaid.js syntax. However, when complex activities are involved, creating the flowchart through Mermaid.js can be exhausting. This section explores how ChatGPT can be utilized alongside Mermaid.js to design effective flowcharts, providing a step-by-step guide.
Crafting with Guidance
Designing flowcharts can be a complex task, but with the assistance of AI like ChatGPT, it becomes a streamlined process. It is important to note that proper instruction will yield a more defined output. Here is how you can leverage ChatGPT’s capabilities to craft flowcharts with Mermaid.js:
- Define the Workflow: Begin by outlining the steps of your workflow or the logic you want to visualize. ChatGPT can help you refine this outline by suggesting improvements or identifying missing elements. For instance, if you’re developing an online healthcare system, you might provide the following instructions:
Project Workflow for the Flowchart diagram:
The website participants will be users and health professionals.
Each user should be able to:
- Register as a user.
- Login if registration is successful using their username and password.
- Set their user profile in the dashboard.
- Book appointments with health professionals.
- Upload their health details to the website.
The health professional should be able to:
- Register as health professionals.
- Login if registration is successful.
- Set profile.
- Accept or reject appointments from users.
- See user health details.
Providing a well-detailed workflow in this manner would enable the AI to understand what you are trying to develop to be of proper help.
- Translate to Mermaid.js Syntax: Once you have a clear outline, ChatGPT can assist in translating these steps into the Mermaid.js syntax. For example, by using the workflow provided, ChatGPT can provide the corresponding if-else structure in Mermaid.js. All you have to do is send the workflow and request a mermaid.js code. Below is a simple illustration.
The generated code is provided below:
graph TD;
    A[Start] --> B(Register as user);
    B --> C(Login);
    C --> D(Set user profile);
    D --> E(Book appointments);
    E --> F(Upload health details);
    F --> G[End];

    A --> A1(Register as health professional);
    A1 --> B1(Login);
    B1 --> C1(Set profile);
    C1 --> D1{Accept or reject appointments?};
    D1 -->|Accept| E1(See user health details);
    D1 -->|Reject| G1[End];
Following these steps, you can create a detailed and accurate Mermaid.js code that enhances your front-end development workflow using ChatGPT.
Exporting Mermaid.js Code to Draw.io
Now that the code has been generated, the next step is to produce a diagrammatic representation, specifically a flowchart, for a project of your choice.
To do this, you will need a professional diagramming tool. In this article, the tool used is draw.io. This tool supports the Mermaid syntax, allowing you to directly insert Mermaid.js code into the editor to generate diagrams. Here are the steps to do so:
- Create a new project: To create a new project,
go to draw.io > Create New Diagram > select filename > select blank diagram > create > save.
The video below will provide you with proper guidance.
- Go to Mermaid text box: After creating your new project, you should see this page displayed:
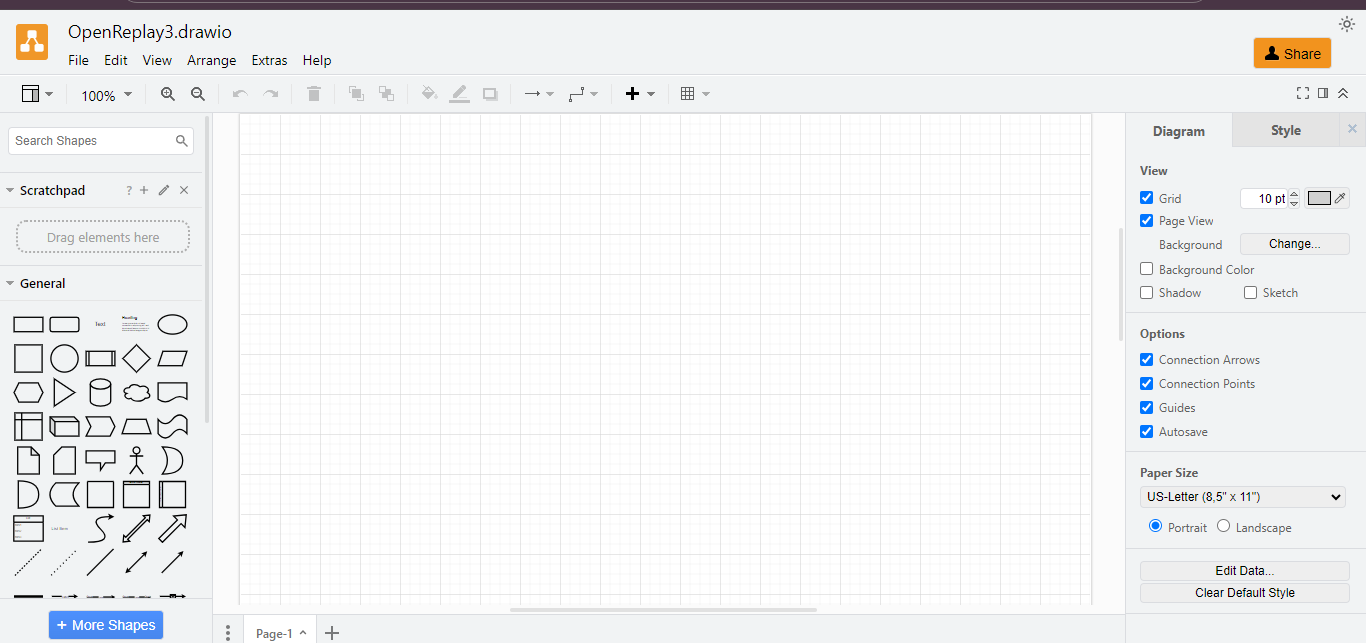
While on this page, go to Arrange > Insert > Advanced > Mermaid. Alternatively, click the + icon in the toolbar, then select Advanced > Mermaid.
Below is what you should do:
- Paste the Mermaid.js Code and generate a diagram: Copy the Mermaid.js code that was generated earlier and paste it into the text box provided in the draw.io interface. After pasting your code, click Insert. Your diagram will be automatically created from your text and inserted as a diagram on the drawing canvas.
This integration allows you to take advantage of Mermaid.js’s text-based diagramming within draw.io’s versatile editing environment.
Conclusion
As we wrap up this exploration of Mermaid.js and its integration with ChatGPT, it is clear that these tools offer a powerful combination for enhancing the web development workflow. By leveraging Mermaid.js, developers can craft detailed, easy-to-understand flowcharts that streamline project planning and communication. Flowcharts are a cornerstone in the planning phase of any web development project, offering a visual method to organize and communicate complex processes. With the added assistance of AI through ChatGPT, this process becomes even more efficient, allowing for rapid iteration and refinement of ideas. The process of creating flowcharts has been demystified, showing that with the right tools, even the most complex workflow can be visualized with ease.
Additional Resources
The journey doesn’t conclude here; rather, it represents an ongoing process of learning and refinement. The resources below will serve as a compass to guide you through the vast landscape of Mermaid.js, ensuring that you continue to grow your expertise and harness the full potential of diagrammatic communication in web development.
- Mermaid documentation.
- draw.io tutorial.
- Learn more about flowcharts.
- An alternative tool for creating diagrams.
Understand every bug
Uncover frustrations, understand bugs and fix slowdowns like never before with OpenReplay — the open-source session replay tool for developers. Self-host it in minutes, and have complete control over your customer data. Check our GitHub repo and join the thousands of developers in our community.
