
Data Analysis with Data-Forge

Data analysis is examining and using data to gain insights and make decisions. It involves taking raw data and applying different methods to interpret it. There are various techniques and tools to do this. One popular tool for data analysis is a JavaScript library called Data-Forge. This article will explore it, teaching you how to load, filter, group, and aggregate data, and also do common data transformation tasks, such as adding, removing, and renaming columns.
Data-Forge is a Node.js library that helps us analyze and interpret data so we can make better decisions. It can work with various data formats, like CSV and JSON. You can use Data-Forge to filter, group data based on specific criteria, and perform analyses on each group.
The library can also transform data by adding new columns or renaming existing ones, allowing us to perform complex data transformations for better decision-making.
Data-Forge helps with data analysis in various ways:
- Data Manipulation: Data-Forge manipulates data by filtering, sorting, grouping, aggregating, and transforming it differently. These operations help clean and prepare data for analysis.
- Data Visualization: Data-Forge can be combined with visualization libraries like Plotly and D3.js to make interactive and engaging visual representations of your data. This can help communicate your findings to others.
- Data Exploration: Data-Forge provides many functions such as mean, median, standard deviation, and more that you can use to understand your data better, find patterns, and predict what might happen.
JavaScript Libraries and Packages for Data Science
Here are some commonly used JavaScript libraries and packages for data science. You can use them to do many tasks in data science, such as cleaning and exploring data, as well as building machine learning models and creating data visualizations.
Machine Learning:
Data Manipulation and Analysis:
Data Visualization:
Statistics and Mathematics:
Installation and Setup
To begin using Data-Forge, you must install it and set up the development environment. This involves creating a new Node.js project, installing Data-Forge as a dependency, and importing it into your JavaScript code.
Let’s have a look at the below steps:
Install Node.js Data-Forge is a Node.js module, so your system must have Node.js installed. You can download and install it from the official website.
Create a new Node.js project After installing Node.js on your system, you must create a new Node.js project using the following command in your terminal. This will create a new project and generate a package.json file.
mkdir new-project
cd new-project
npm init -y
Install Data-Forge: To install Data-Forge in your project, use this command. It will install the library and its dependencies.
npm install data-forgeImport Data-Forge: To use Data-Forge in your project, you’ll need to import it. You can do this by adding the following code to your JavaScript file:
const dataForge = require("data-forge");Note: You can download the CSV file from here.
Loading Data
You can load data from various sources, including CSV files, JSON files, arrays, etc. In this code, we will load data from a CSV file.
Note that here, we are fetching data from an external (CSV) file. If you want to read or write data from a file, use the Node.js fs module or some other file system library. Therefore, you must first install this module using npm install data-forge-fs and then import it using the require function.
Let’s take a look at an example:
// Import modules
const dataForge = require("data-forge");

// Load the data into a data frame
const dataFrame = new dataForge.DataFrame({
  columnNames: ["date", "product", "price", "quantity"],
  rows: [
    ["01-03-2023", "Apples", 3, 10],
    ["02-03-2023", "Bananas", 2, 20],
    ["03-03-2023", "Oranges", 4, 5],
    ["05-03-2023", "Strawberries", 8, 8],
    ["06-03-2023", "Blueberries", 7, 12],
    ["09-03-2023", "Grapes", 9, 5],
    ["10-03-2023", "Kiwis", 8, 15],
    ["15-03-2023", "Pineapples", 7, 15],
    ["03-04-2023", "Papayas", 6, 20],
  ],
});

// Display the first 5 rows of the data frame
console.log(dataFrame.head(5).toString());
This results in the following:
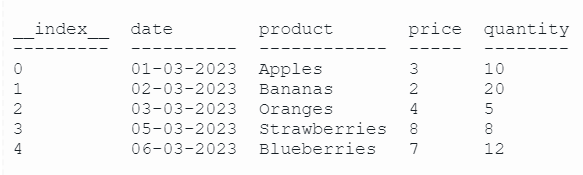
In the code above, you must first import the data-forge and data-forge-fs modules using the required function. Then, specify the path to the CSV file and use the fs.readFileSync method, and parse it into a data frame using the parseCSV method, which returns a data frame containing the data from the CSV file. Finally, you can print the data frame to the console using the toString method, which generates a string representation of the data frame.
Filtering Data
Filtering data is important in data analysis to extract the desired data subset. Data-Forge provides a where function to filter data based on specific conditions.
Let’s take a look at an example:
// Import modules
const dataForge = require("data-forge");

// Load the data into a data frame
const dataFrame = new dataForge.DataFrame({
  columnNames: ["date", "product", "price", "quantity"],
  rows: [
    ["01-03-2023", "Apples", 3, 10],
    ["02-03-2023", "Bananas", 2, 20],
    ["03-03-2023", "Oranges", 4, 5],
    ["05-03-2023", "Strawberries", 8, 8],
    ["06-03-2023", "Blueberries", 7, 12],
    ["09-03-2023", "Grapes", 9, 5],
    ["10-03-2023", "Kiwis", 8, 15],
    ["15-03-2023", "Pineapples", 7, 15],
    ["03-04-2023", "Papayas", 6, 20],
  ],
});

// Filter data
const filteredData = dataFrame.where(
  (row) => row.price > 5 && row.product === "Grapes"
);

// Display filtered data
console.log(filteredData.toString());
This results in the following:
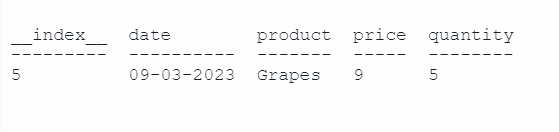
In this example, we use the where function to filter the data based on the condition that the price is greater than 5 and the product is ‘Grapes’. The resulting filteredData DataFrame object will only include the rows that meet these criteria.
Grouping Data
Grouping data is a crucial aspect of data analysis. It allows us to group data based on specific criteria and analyze each group. With Data-Forge, you can group data and perform analysis on each group.
Let’s take a look at an example:
// Import modules
const dataForge = require("data-forge");

// Load the data into a data frame
const dataFrame = new dataForge.DataFrame({
  columnNames: ["date", "product", "price", "quantity"],
  rows: [
    ["01-03-2023", "Apples", 3, 10],
    ["02-03-2023", "Bananas", 2, 20],
    ["03-03-2023", "Oranges", 4, 5],
    ["05-03-2023", "Strawberries", 8, 8],
    ["06-03-2023", "Blueberries", 7, 12],
    ["09-03-2023", "Grapes", 9, 5],
    ["10-03-2023", "Kiwis", 8, 15],
    ["15-03-2023", "Pineapples", 7, 15],
    ["03-04-2023", "Papayas", 6, 20],
  ],
});

// Group the data by column 'product' and count the values
const groupedData = dataFrame.groupBy((row) => row.product);

// Display grouped data
console.log(groupedData.toString());
This results in the following:
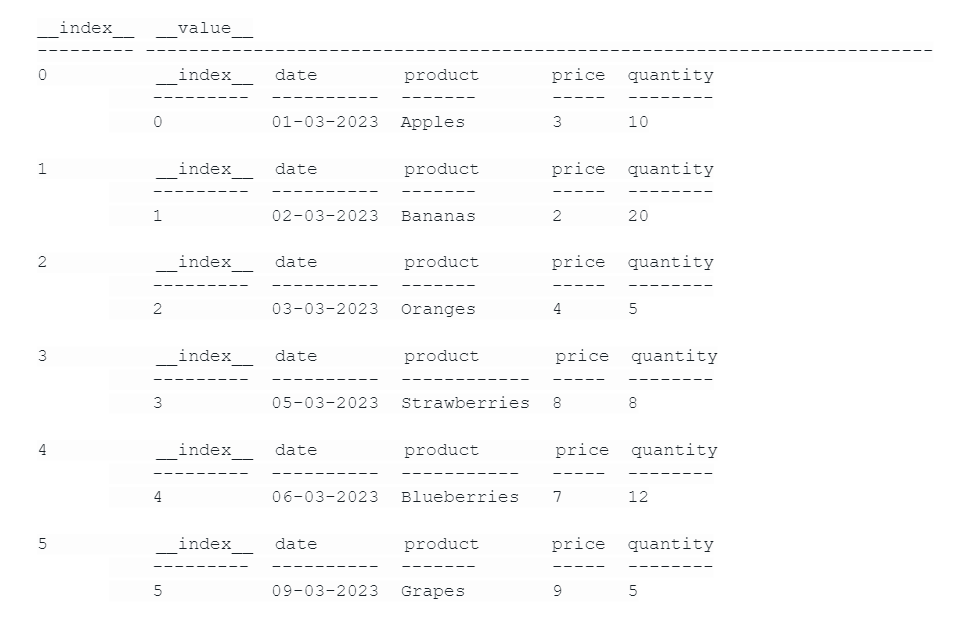
Note: If you use the groupby function alone, the resulting table may have badly formatted columns. For example, you may see the date in the index column and the product in the date column. I have raised this issue with the Data-Forge community, and if I receive any updates, I will fix it.
In this example, we group the data based on the product column using the groupBy function and display the resulting grouped data on the console using the toString method.
Aggregating Data:
Aggregating data involves calculating summary statistics for each group of data. With Data-Forge, we can perform various aggregation functions like average, mean, count, max, and more.
Let’s take a look at an example:
// Import modules
const dataForge = require("data-forge");

// Load the data into a data frame
const dataFrame = new dataForge.DataFrame({
  columnNames: ["date", "product", "price", "quantity"],
  rows: [
    ["01-03-2023", "Apples", 3, 10],
    ["02-03-2023", "Bananas", 2, 20],
    ["03-03-2023", "Oranges", 4, 5],
    ["05-03-2023", "Strawberries", 8, 8],
    ["06-03-2023", "Blueberries", 7, 12],
    ["09-03-2023", "Grapes", 9, 5],
    ["10-03-2023", "Kiwis", 8, 15],
    ["15-03-2023", "Pineapples", 7, 15],
    ["03-04-2023", "Papayas", 6, 20],
  ],
});

// Group the data by column 'product' and aggregate
const aggregatedData = dataFrame
  .groupBy((row) => row.product)
  .select((group) => ({
    product: group.first().product,
    count: group.count(),
    averagePrice: group.deflate((row) => row.price).average(),
    sumPrice: group.deflate((row) => row.price).sum(),
    maxPrice: group.deflate((row) => row.price).max(),
    minPrice: group.deflate((row) => row.price).min(),
  }))
  .inflate();

// Display the aggregated data in the console
console.log(aggregatedData.toString());
This results in:
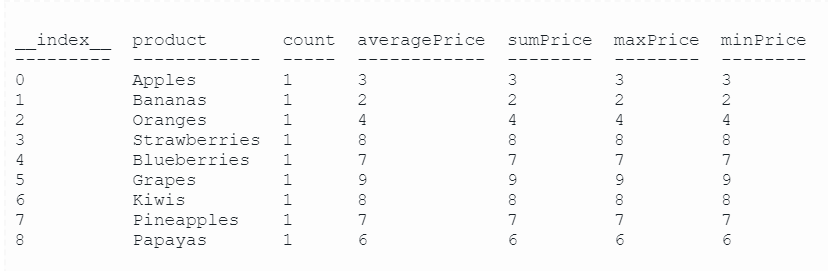
In the code above, we first use the groupBy method to group the data by the product column. Then, we perform aggregation using various functions such as average, count, max, and min to calculate the average value, count, maximum value, and minimum value for each group, respectively.
Once we have aggregated the data, we display the resulting DataFrame object using the toString method.
Note: inflate is a function in Data-Forge that is used to convert aggregated or summarized data (obtained through groupBy) into a nested structure that can be more convenient to work with. Read more about inflate here.
Session Replay for Developers
Uncover frustrations, understand bugs and fix slowdowns like never before with OpenReplay — an open-source session replay tool for developers. Self-host it in minutes, and have complete control over your customer data. Check our GitHub repo and join the thousands of developers in our community.
Transforming Data
You can use Data-Forge to transform data in various ways, such as adding new columns, renaming columns, removing columns, and more.
Adding New Columns:
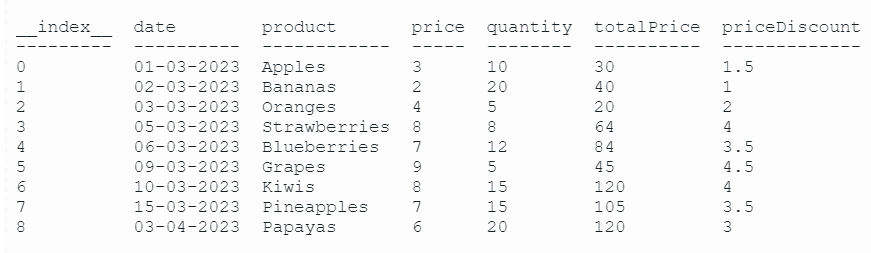
Below, we use the generateSeries method to add two new columns to the data: ‘totalPrice’ and ‘priceDiscount’. The ‘totalPrice’ column is calculated as the product of ‘price’ and ‘quantity’, while the ‘priceDiscount’ column is calculated as half of the ‘price’ subtracted from the original price.
// Import modules
const dataForge = require("data-forge");

// Load the data into a data frame
const dataFrame = new dataForge.DataFrame({
  columnNames: ["date", "product", "price", "quantity"],
  rows: [
    ["01-03-2023", "Apples", 3, 10],
    ["02-03-2023", "Bananas", 2, 20],
    ["03-03-2023", "Oranges", 4, 5],
    ["05-03-2023", "Strawberries", 8, 8],
    ["06-03-2023", "Blueberries", 7, 12],
    ["09-03-2023", "Grapes", 9, 5],
    ["10-03-2023", "Kiwis", 8, 15],
    ["15-03-2023", "Pineapples", 7, 15],
    ["03-04-2023", "Papayas", 6, 20],
  ],
});

// Add new columns: 'totalPrice' & 'priceDiscount'
const transformedData = dataFrame.generateSeries({
  totalPrice: (row) => row.price * row.quantity,
  priceDiscount: (row) => row.price - row.price * 0.5,
});

// Display output
console.log(transformedData.toString());
This results in the following:
Rename Columns:
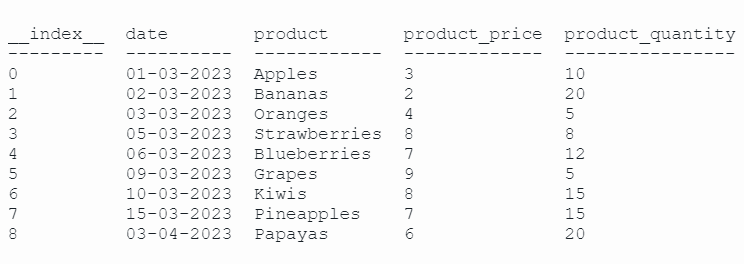
Below, we use the renameSeries method to rename the ‘price’ and ‘quantity’ columns to ‘product_price’ and ‘product_quantity’, respectively.
// Import modules
const dataForge = require("data-forge");

// Load the data into a data frame
const dataFrame = new dataForge.DataFrame({
  columnNames: ["date", "product", "price", "quantity"],
  rows: [
    ["01-03-2023", "Apples", 3, 10],
    ["02-03-2023", "Bananas", 2, 20],
    ["03-03-2023", "Oranges", 4, 5],
    ["05-03-2023", "Strawberries", 8, 8],
    ["06-03-2023", "Blueberries", 7, 12],
    ["09-03-2023", "Grapes", 9, 5],
    ["10-03-2023", "Kiwis", 8, 15],
    ["15-03-2023", "Pineapples", 7, 15],
    ["03-04-2023", "Papayas", 6, 20],
  ],
});

// Rename the columns 'price' to 'product_price' and 'quantity' to 'product_quantity'
const transformedData = dataFrame.renameSeries({
  price: "product_price",
  quantity: "product_quantity",
});

// Display output
console.log(transformedData.toString());
This results in the following:
Remove Columns:
The dropSeries function in Data-Forge is used to remove columns from a DataFrame. You simply provide an array of the column names you want to remove, and dropSeries returns a new DataFrame that excludes those columns, as shown in the below code.
// Import modules
const dataForge = require("data-forge");

// Load the data into a data frame
const dataFrame = new dataForge.DataFrame({
  columnNames: ["date", "product", "price", "quantity"],
  rows: [
    ["01-03-2023", "Apples", 3, 10],
    ["02-03-2023", "Bananas", 2, 20],
    ["03-03-2023", "Oranges", 4, 5],
    ["05-03-2023", "Strawberries", 8, 8],
    ["06-03-2023", "Blueberries", 7, 12],
    ["09-03-2023", "Grapes", 9, 5],
    ["10-03-2023", "Kiwis", 8, 15],
    ["15-03-2023", "Pineapples", 7, 15],
    ["03-04-2023", "Papayas", 6, 20],
  ],
});

// Remove the 'product' column
const transformedData = dataFrame.dropSeries(["product"]);

// Display output
console.log(transformedData.toString());
This results in the following:

Conclusion
In this article, we took a look at the Data-Forge library and learned how it can help us with data analysis. We saw how to load, filter, group, and aggregate data and even got our hands dirty with some data transformation tasks like adding new columns, removing unnecessary ones, and renaming the ones we needed.
Gain Debugging Superpowers
Unleash the power of session replay to reproduce bugs and track user frustrations. Get complete visibility into your frontend with OpenReplay, the most advanced open-source session replay tool for developers.
