Debugging TypeScript with Visual Studio Code


Have you ever struggled with debugging your TypeScript code or wondered how to do it more quickly? Due to TypeScript’s transpilation process, debugging is more complex, but VS Code has built-in debugging support for it. This article will give you a practical, step-by-step guide on how to configure the IDE for easily debugging your TypeScript work.

Discover how at OpenReplay.com.
This tutorial will cover debugging TypeScript using VS Code. It assumes that you have already installed TypeScript and initialized a package.json file for your project; if not, find out how to download TypeScript and set the necessary configurations.
You will need to set some configurations to debug your TypeScript program with VS Code. We will go over this process step by step:
First, you need to generate the TypeScript configuration file (tsconfig.json) and set some configurations in it. This file shows the directory where it is generated, which is the root directory of your TypeScript project, and it specifies the root files and the compiler options for compiling your code. It helps the compiler generate JavaScript files.
To generate this configuration file, run this command:
tsc --initYou can quickly run this command in your project directory using the VS Code terminal, as shown below:

This generates the tsconfig.json file, which contains different rule sets for your program. Leave the existing rules set.
You can set an output folder name to save the transpiled JavaScript by uncommenting the "outDir" rule in the tsconfig.json file and specifying the name you want the folder to have, for example:
"outDir": "./output"Here, you are setting the folder’s name as output.
Also, you can uncomment the "rootDir" rule and let it point to the current directory with your source file. By convention, we usually put the source files in a separate folder. So, create an src folder in the current directory or use any other name you want to call this folder. This folder is where your source files will be; here is the rule:
"rootDir": "./src"Here, we ensure our source files will be in a folder called src.
You need to set the sourceMap rule to “true” by uncommenting it. This particular rule specifies how each line of your TypeScript code maps to the generated JavaScript code. Below is how you can do this:
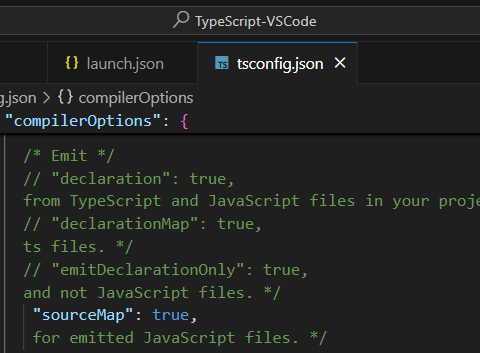
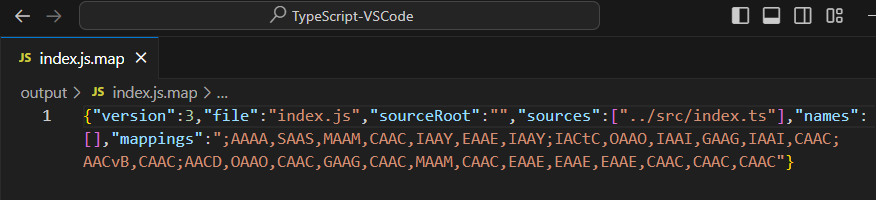
With this rule set, go to the folder you set in your outDir rule, and you will see a .js.map file, which is the source map. This will enable a debugger to see the original TypeScript code instead of the transpiled JavaScript code. It will enable you to configure and save your project’s debugging setup details. Below is how the .js.map file looks:
Debugging TypeScript with VS Code
In this section, we will discuss how to use VS Code to debug a TypeScript program. VS Code has a debug panel that we can use to debug our code. This feature is located on the left sidebar, and you can access it by clicking on the “Run and debug” icon or by pressing ctrl+shift+D on Windows/Linux or cmd+shift+D on Mac.
With this, we can now proceed to the core aspect of using VS Code to debug TypeScript.
Using the launch.json File
We will need a launch.json file to set more advanced configurations that will enable us to launch and debug our program.
We can create this file by clicking the “Run and Debug” icon we described above. Then click on the “create a launch.json file” button and select “node.js” from the dropdown list as shown below:
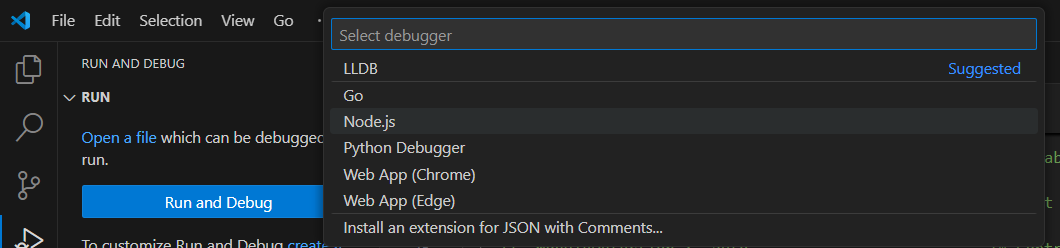
This creates a new file, launch.json, in your project folder, with some configurations that tell VS Code how to debug the application.
When you open the generated launch.json file, notice the program rule has the destination below:
"program": "${workspaceFolder}/src/index.ts"This rule can be okay if it is only one source file (index.ts) you are working with, but if your program requires more source files, then you have to adjust it. We must set the program to point to our transpiled destination folder, which has the extension .js. We named this folder “output”. See below how you can adjust it:
"program": "${workspaceFolder}/output/index.js"Here, we set it to our output folder. If you omit this setup for a program with many source files, your program won’t run and debug.
How to Start Debugging TypeScript
To start debugging, create an index.ts file in the src folder. The index.ts file is where we will write our TypeScript code. Now run the command: tsc, without any option. You will see an output folder has been generated, as we specified “output” as the name of the folder in which we want our transpiled code to be saved.
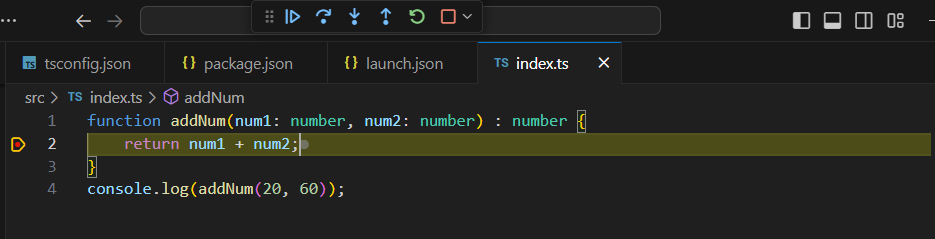
Now let us write a basic TypeScript code of a function that adds two numbers and logs the result of these numbers to the console in the index.ts file to see how we can start debugging:
function addNum(num1: number, num2: number): number {
  return num1 + num2;
}
console.log(addNum(20, 60));
Now run the code with the tsc command. In this file, let’s set a breakpoint that will stop the execution of our code at the particular line we put it. From this point forward, we can execute our code line by line. You will see where to set breakpoints before the line numbering of each line, and it is a red dot. If you hover over this red dot, you will see the information “click to add a breakpoint”; when you click it, you set breakpoints for that line. With this breakpoint, you can go over your codes line by line to see if they have any problem.
Let’s set a breakpoint on the second line of our code. To start debugging, click on the “debug panel,” then click on the “launch program” button with a play icon at the top or press f5.
Here we see that our program started and execution stopped at the breakpoint line, as shown below:
Moving Through the Debugging Session
If you observed well when you launched the program, several tools appeared at the top. These tools help us execute our code as we want based on our breakpoint, which forms the debugging options. They enable moving through our code to specify which to execute and which not to.
Let us look at these tools:
-
Continue: This continues the execution process on the current line
-
Step over: This helps us to execute the following line.
-
Step into: This is for stepping into a function and helps when your program has many functions.
-
Step out: This is used to step outside of a function.
-
Restart: This starts the execution process over again.
-
Stop: Stops the execution.
-
Discontinue: This is similar to stop as it terminates any execution.
We will understand the practicality of these tools when we look at a practical example subsequently.
Practical Example of Debugging TypeScript Code with VS Code
We have seen a basic example of how to use the VS Code debug panel on our TypeScript program; now, we will look at a more practical example and how to move through our lines of code and execute them by following a debug lense.
Let us look at a class for schools and subjects taught in the schools:
class MySchool {
  schoolName: string;

  constructor(schoolName: string) {
    this.schoolName = schoolName;
  }

  students(subjects: string) {
    console.log(
      `The name of my school is ${this.schoolName} and we learn ${subjects}`
    );
  }

  age(myAge: number) {
    console.log(`I am ${myAge} years old`);
  }
}

let school = new MySchool("King's College");
school.students('Mathematics');
school.age(12);

let school2 = new MySchool("Queen's College");
school2.students('English');
school2.age(15);
With the above TypeScript code, let us go into the debugging process:
First, we have to transpile our code using the tsc command, then set breakpoints where we want execution to stop so we can start debugging. Let’s set a breakpoint at the first line, then click on the debug panel and launch the program to debug.
Notice that the execution stopped at the fifth line; this is because no implementation happens from the first to the fourth line, as they are basically declarations. See below:
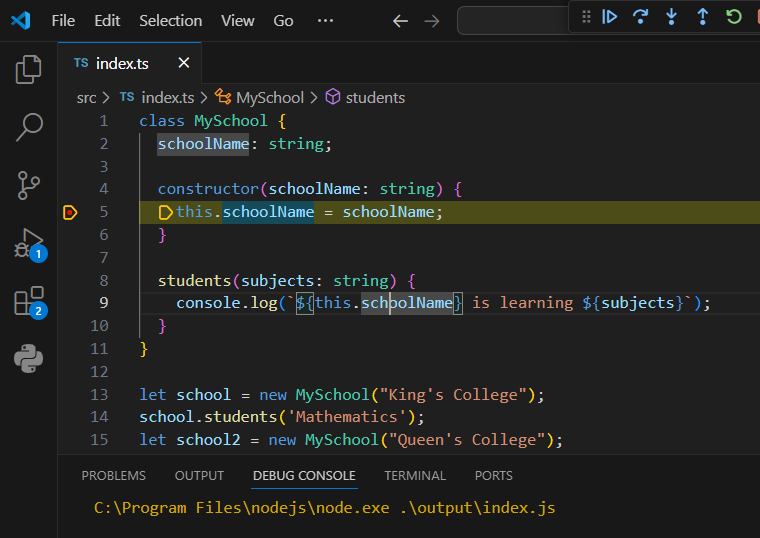
So, ensure you set the breakpoints where execution occurs; if not, it will skip to the following line where execution occurs. Now, we can start using the debug tools. From this fifth line, click on “step over” or press f10. You will see that execution stops at the following line, thereby executing the line before the step, as shown below:
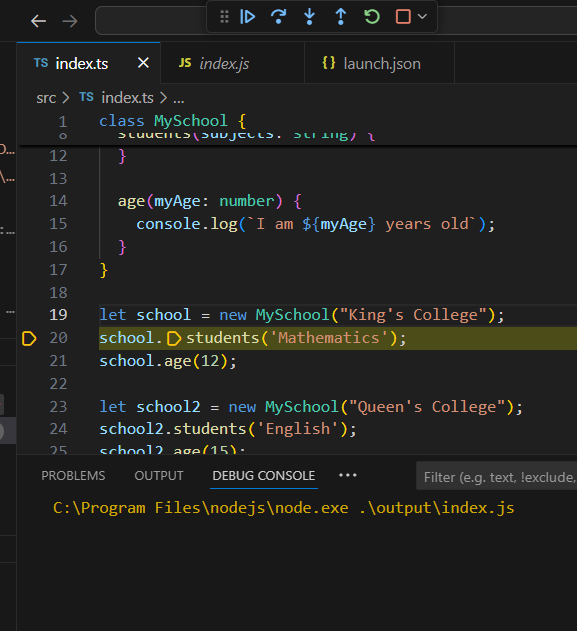
Here, nothing is displayed on the debug console because no object has been instantiated yet.
If we continue stepping over, you will see it will jump functions(methods) and go to the instantiation line (school.students('Mathematics');), thereby executing the line before it. But nothing is still displayed on the debug console because we are merely passing arguments to the MySchool class.
Again, we step over the following line, and execution stops on that line, and the previous line’s output is displayed on the debug console showing “The name of my school is King’s College and we learn Mathematics,” as seen below:
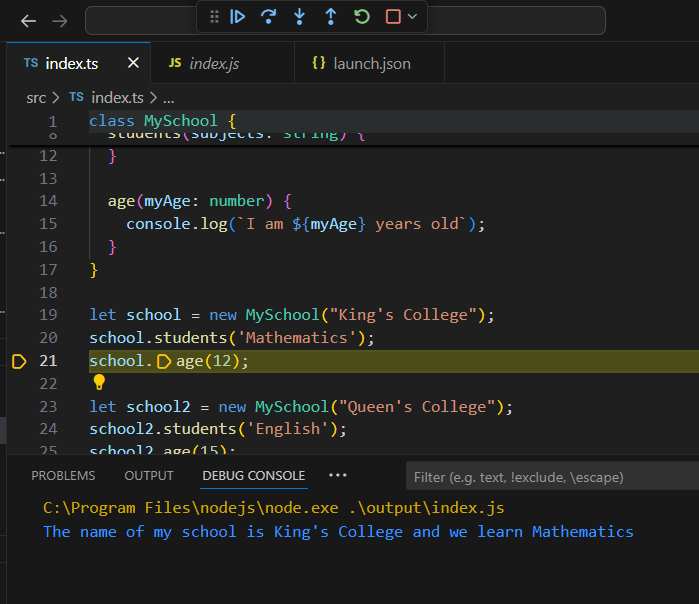
By the time you step over to the end, you see all the output displayed on the debug console, as shown below:

You can also examine the variables, set watches, and call stack.
This is how you will continue debugging and observing if you are getting the correct output.
Setting Automatic Transpilation
Whenever you make changes to your TypeScript code, you must transpile with the tsc command before you can start the debugging process; if not, the initial code will be running. This approach can be exhausting, especially if you have many files. You can save yourself this headache by setting up an automatic watch process that transpiles your code in the background for you. Here is how you can do this:
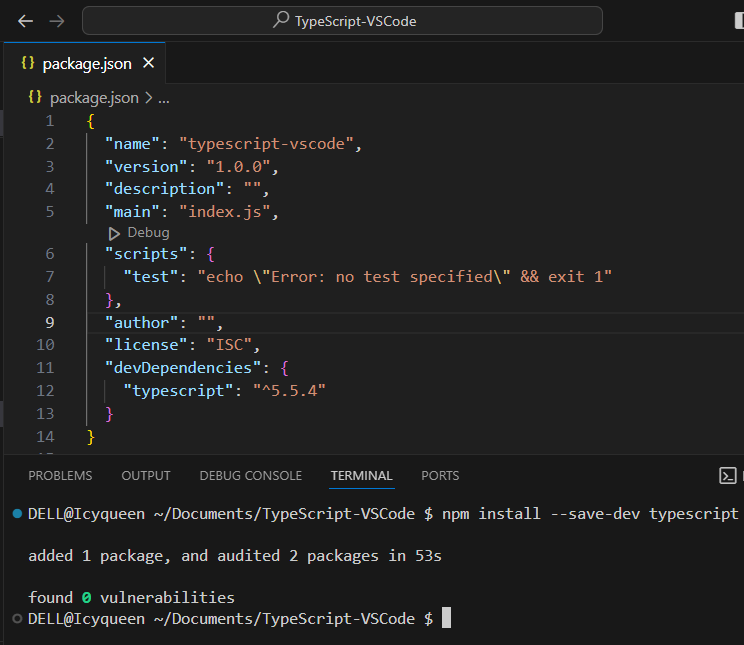
First, notice that in your package.json file, you do not have a section for devDependencies. You will need to set rules for this section so that you can install a copy of TypeScript locally in your project using the command below:
npm install --save-dev typescriptAfter the installation, you will see the dependencies section called devDependencies with TypeScript installed, as shown below:
Now press f1 and search Tasks: Configure Default Build Task, then select tsc: watch - tsconfig.json. This creates a brand new file called tasks.json, as shown below:
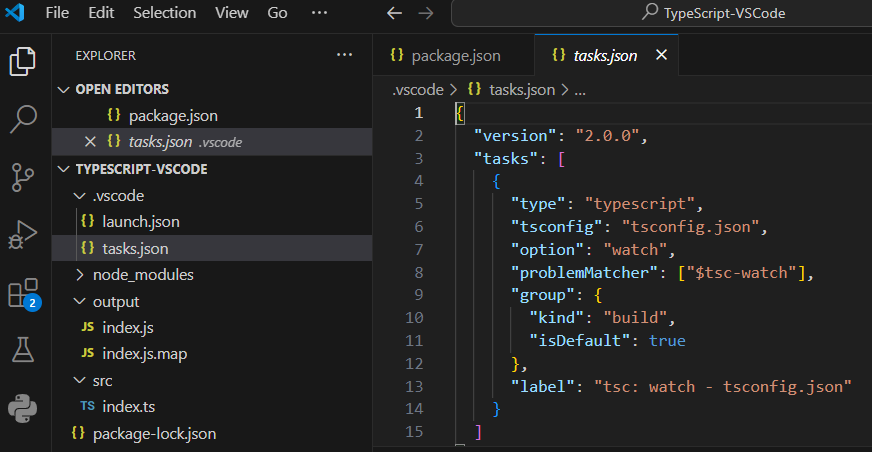
This file has all the necessary rules to watch your code.
Finally, press f1 and select Tasks: Run Build Task; this creates a new instance of your code that watches it.
Conclusion
Debugging TypeScript in VS Code is fantastic because when things go wrong in our program, we can look at our codes line by line to know what actually happened. This article thoroughly explains how you can effectively use VS Code to debug your TypeScript program. You can explore more to see the magic.
Understand every bug
Uncover frustrations, understand bugs and fix slowdowns like never before with OpenReplay — the open-source session replay tool for developers. Self-host it in minutes, and have complete control over your customer data. Check our GitHub repo and join the thousands of developers in our community.