
How to Debug Angular Apps with Chrome DevTools

We’ll be covering some of the tactics and DevTools Angular developers use for debugging their applications, not only in their very predictable development environment, but also in production when their code comes to life and things may go sideways. Besides, what better way of deeply understanding a language or framework if not by looking at its inner workings.
(Most of the learnings here are applicable to all frontend applications)
Angular Debugging Tools
One of the most popular extensions—for debugging and profiling Angular apps—is definitely Augury, available on both Firefox and Chrome.
Augury gives a visual representation of Angular components alongside their dependencies and router details. It makes it easy to:
- Inspect the source code of a component and insert breakpoints.
- Manipulate a component’s properties, visualize its hierarchy and see its dependencies.
- Browse the routing system, track lazy-loaded components and see navigation flows.
- List all modules that the application is using and check their providers and exports.
How to debug with Chrome DevTools
Angular Augury is definitely a big plus, but the best debugging tool comes already bundled with your browser. The good old “inspector” will boost your productivity when it comes to debugging JavaScript, tweaking DOM and CSS, inspecting network activity, analyzing performance, tracking down memory leaks and much more.
Console
The Console serves two objectives at least: display of your application’s logs plus runtime errors and ability to execute custom JS code.

Developers may be logging messages using console.log() to inspect the value of some variable or simply ensure their code is executing in the right order. Warnings and the majority of runtime errors get also printed here. See console JS object to learn what you can do with it.

On top of that, your Console is a REPL environment and has full access to window. In other words, you can use it to run custom JavaScript code that interacts with your Angular application. More about the Console Utilities API.
Network Panel
This where your entire application’s network activity will be logged. All resources, whether downloaded or uploaded, are available for inspection in the Network panel. These resources are listed chronologically with information such as HTTP response code, loading time, initiator, state and size. The footer contains a summary of the total number of requests and the size of all resources.

This list view helps easily spot requests that failed (the red ones) and those that are pending and may soon timeout. If you’re looking for CORS issues, it’s better to start from Console then eventually switch to Network (these requests appear in white, as successful).

Clicking on a specific resource opens a detailed panel where HTTP Headers are shown, alongside the Response and even an HTML Preview of it. It’s in fact easier to debug the received data or simply inspect images here than in your HTML source code.

And finally the Timing breakdown which can prove very useful when investigating requests that take a long time to download, either due to a poor connection between your Angular application and the server (consider using a CDN if Time To First Byte is high) or to a slow backend if that server is hosted locally.
Tips: Hit Preserve log to keep the logs when navigating from one page to another, and check Disable cache so resources won’t be served from cache when DevTools is open.
JS Debugger
This is by far the most powerful tool available in DevTools, and you can find it under the Sources tab.
Breakpoints
This a faster and cleaner alternative to using console.log() when looking for bugs. It allows for quick inspection of the piece of code being executed and the values of all variables at that moment in time.

The execution comes to a halt as soon as it reaches the breakpoint. And you can set many of them at the same time. From there you can deep dive into your code using the different options at hand:
- Step through the code by resuming execution, one line at a time, or hop on to the next function call.
- Check the callstack and see what functions are called and their order.
- Scope pane is where all your local, global and closure (when applicable) variables get printed. You can change their values and see how it affects your application upon resuming execution.
- Watch a specific variable by tracking its value over time. You can even use JS expressions here.
- Console has access to the application state, use it to change values and to keep an eye on your
console.log()messages.
Other types of breakpoints are available:
- DOM — when a node or its children gets changed or removed.
- XHR — triggered when the requested URL contains a specific string.
- Event Listener — pauses on the code that runs right after an event is fired, say
clickor specific categories of events (all mouse related).
Run Snippets
From the same Sources panel, you can save your repetitive code into Snippets. They have access to your JavaScript context and can be run anywhere in your application.
Local Overrides
Who doesn’t hate losing changes whenever you hit that reload button? Local Overrides were made to overcome this. Specify a directory in Sources -> Overrides and let DevTools save your changes. It works in most situations (see limitations).
Store Specific Tools
DevTools might not be enough whenever you need to deep dive into some specific issues related to your store. Here are some of the tools you may use for Redux and NgRx:
Redux
- redux-logger — for keeping track of your redux actions and state changes.
- redux-devtools — this comes a browser extension or a library and provides power-ups for redux related issues, including the ability to export the store in JSON format.
NgRx
ngrx-store-devtools — for store instrumentation. Works with the redux-devtools browser extension.
HTML Structure & CSS
The Element tab is where you do all your DOM related activities. It allows you to edit the DOM and CSS on the fly.
Inspect DOM

You can inspect any particular DOM node, change its content, attribute or type and force its state (like :hover). You can remove nodes or reorder your tree by drag and dropping them and see how it renders.
DevTools lets you also use nodes in Console and even store them as global variables in case you need to refer back to them. But perhaps the most useful trick is to pause your JavaScript whenever it tries to update a DOM node. You can do that by adding a break on attribute change, node removal or subtree modification.
Edit Styles

On the right side of the panel you can see the CSS styles that are applied to the selected DOM element. DevTools lets you inspect styles in different ways by editing them, or by adding new styles and rules. The box at the bottom helps with the margins, paddings, dimensions and border.
Make sure to persist your changes to the development workspace if you don’t want them to disappear upon the next reload.
Performance Audit
Chrome DevTools offers several ways (across various panels) to audit and improve the performance of your Angular application.
Loading Speed
The Audits tab is where you can look for bottlenecks hurting your page’s loading speed. Open your application in incognito mode as some browser plugins may interfere with the auditing workflow.
Start with an audit as it creates a baseline to measure your changes against, but also gives you some actionable tips on how to improve. The available options let you run different categories of audits: SEO, accessibility or performance oriented. It also helps simulate how your application behaves on a mobile device (viewport and bandwidth/CPU throttling).

Results show the overall score (the higher the better) and a set of different sections:
- Metrics — laying out the different aspects of the loading experience, such as when the content is displayed (First Contentful Paint) or when page is ready for user interactions (Time To Interactive).
- Opportunities — with suggestions on how to speed up the page.
- Diagnostics — full of details on how to improve performance.
Tip: Isolate your changes by making one improvement at a time, before rerunning an audit for measuring how it affected performance.
Memory Leaks
Memory issues are obvious and oftentimes noticed by your users as your application will tend to either pause (GarbageCollector kicks in more frequently than it should) or becomes slower throughout the session (think memory leak).

A dedicated Memory tab helps investigate these issues. Track down memory leaks by monitoring your JS heap (in Allocation timelines) and by finding detached DOM nodes — those removed from the tree but still being referenced by some JS — using Heap snapshots. You can even dissect memory allocation by function. Learn more about this topic here.
Learn more about memory problems.
CPU Profiler

You can record a JavaScript CPU profile and examine the functions that have impact on your application’s performance. Results can be shown in 3 ways: top-down (tree), by impact(heavy) or chronologically (flame chart).
Frames per second
FPS is captured alongside other metrics by DevTools at execution time. It is useful for spotting slow animations that hurt your user experience. Low framerates translate in red bars on the chart.

DevTools also offers an FPS meter, producing real-time estimations at runtime, and CPU throttling for simulation on mobile devices.
How to debug Production issues?
Issues reported by users do often lack the full context to have a complete understanding of what happened. “X doesn’t work” doesn’t obviously help you. Not to mention the time it takes to collect clues from your users with the hope of being able to reproduce the problem locally. Besides, how many of them would bother to submit a ticket or share a bad experience? An extremely tiny fraction I guess.
So don’t go easy on logs. Anything that helps you make sense of a bug is useful. Below are a few tips on what’s worth tracking.
Monitor your XHR
Make sure to log the XHR requests that failed (5xx/4xx) and their responses. Most HTTP libraries will allow you to easily handle such cases.
Catch your JS errors
Runtime errors are critical for diagnosing issues. They are worth a thousand log entries and provide an accurate picture of the problem. Store them on your server for later retrieval. If you had to log only one thing, start with JS errors.
Track your App’s State
Whether using Redux or NgRx, take the time to log your application’s state changes and actions. If you’re on Redux, you can even replay them in your browser with redux-slider-monitor. This would come in handy for thorough debugging of production issues.
Record your user actions
Logging user actions and journeys is a powerful, yet underused technique in debugging. Such strategy is widely used by marketers who track down each and every frustration that may affect the overall user experience, ranging from rage clicks to incorrect rendering of certain elements in the web app. Tools like Mixpanel, Amplitude or Heap haven’t been designed for developers and therefore rarely used by them. But this is not an excuse for not simply logging your user steps after sanitizing any residual private data.
In fact, being able to mentally visualize your user journey — while they experience an issue in production — and at the same time see how that affected your Angular stack is simply HUGE. It’s the ultimate root cause analysis technique and a serious productivity booster.

Open Source Session Replay
OpenReplay is an open-source, session replay suite that lets you see what users do on your web app, helping you troubleshoot issues faster. OpenReplay is self-hosted for full control over your data.
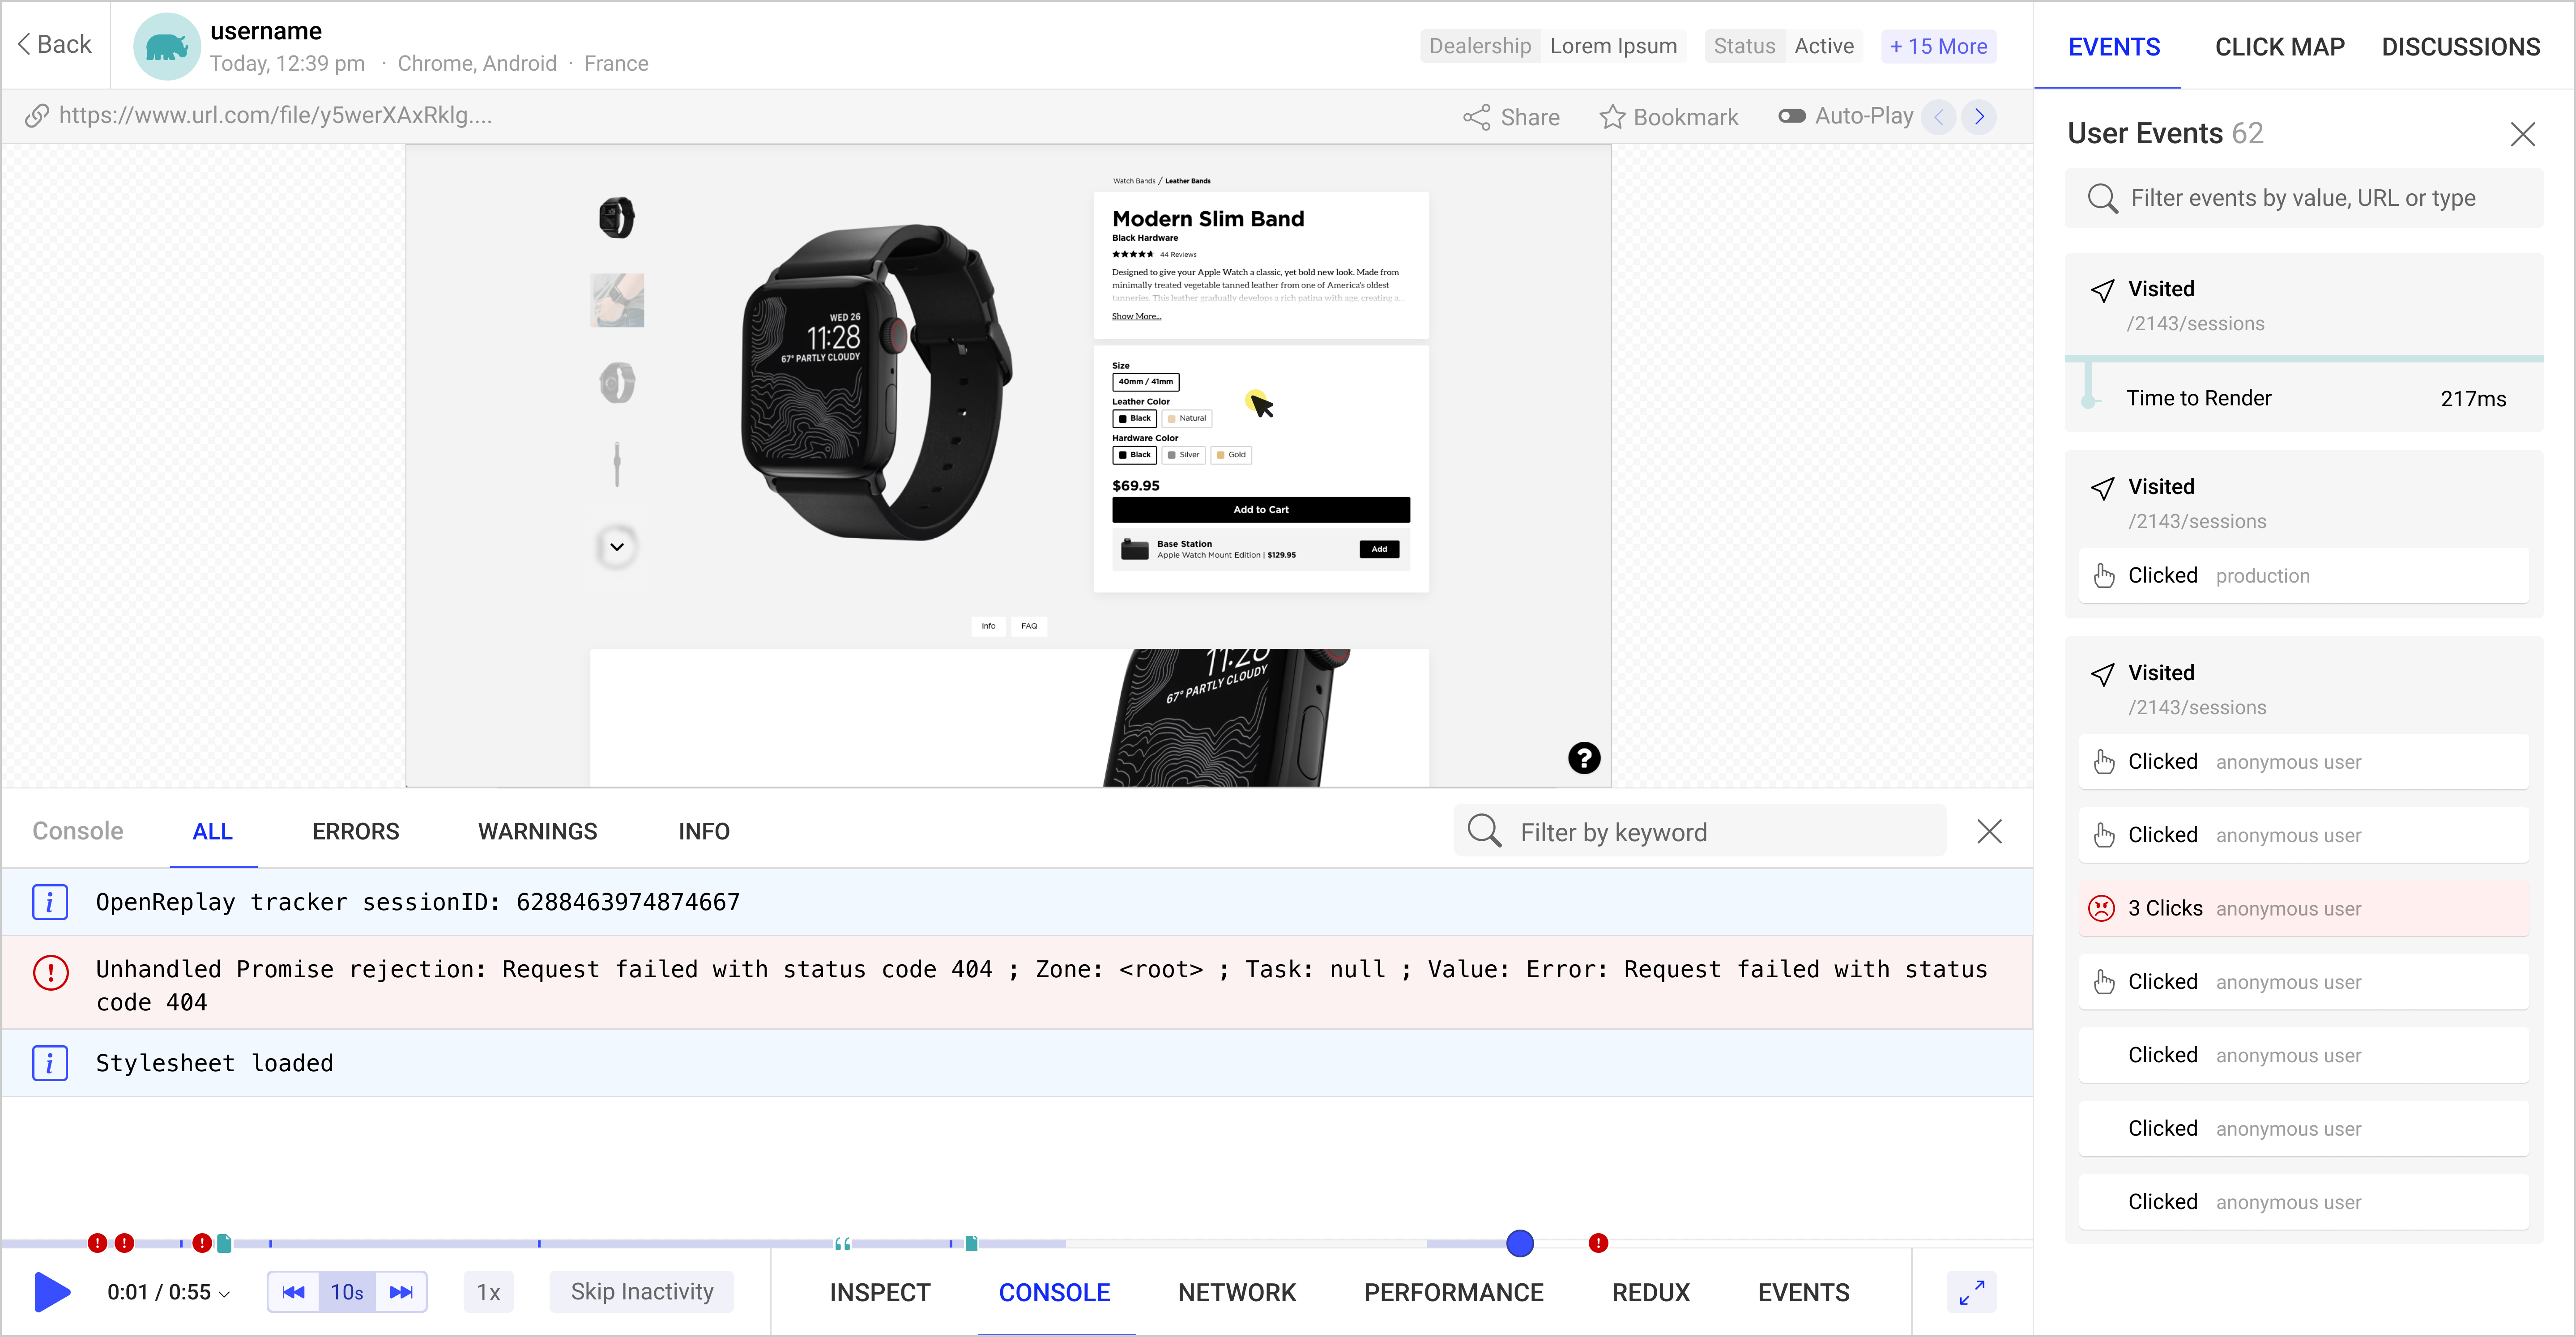
Start enjoying your debugging experience - start using OpenReplay for free.