
Speed is crucial, and multiple studies prove this, so this article will give you a leg up on gaining and keeping users by showing you tips for optimizing the performance and loading speed of your pages.

Discover how at OpenReplay.com.
We’ll pretend we’re website users and forget we’re developers. You understand how annoying it is when you click on a website and it takes forever to load. Or even worse, the text on the website loads, but the images and videos load at their own pace. We often leave the website in annoyance and click on another related website.
According to John Mueller, Senior Search Analyst at Google, the best practice is to get your website to load in less than two to three seconds. Similarly, according to a study conducted by Google in 2017, as page load time goes from one second to three seconds, the probability of a bounce increases by 32%.
When users open a single page on your site and leave without triggering additional requests, it is known as a bounce.
Franka asks a crucial question because this concept makes her think.

Little does Franka know that according to Portent, 2019:
- The first five seconds of page-load time impact conversion rates the most.
- The highest e-commerce conversion rates occur on pages with load times between 0 and 2 seconds.
- Website conversion rates drop by an average of 4.42% with each additional second of load time (between seconds 0-5).
User experience and SEO ranking are significantly impacted by web application optimization. In this article, we’ll discuss why websites aren’t optimized and how to make them more responsive. We will examine various methods for achieving this objective, as well as tools for measuring web performance and page load times.
Diagnosing Performance Bottlenecks
Understanding the factors hindering a website’s overall speed and efficiency is the first step in optimizing it. Among these elements are:
- Large file sizes
- HTTP requests that are excessive
- Inefficient code
- Response time of the server
- Inadequate caching techniques
- Excessive plugin installation (for WordPress users)
- CMS (Content Management System) is out of date.
- Services of poor quality for hosting
After reading through this list, Franka says:

Let’s take a closer look at some of the tools we can use to analyze the performance of our websites.
Tools for Analyzing Web Performance
Several tools are available to analyze website performance. These tools include:
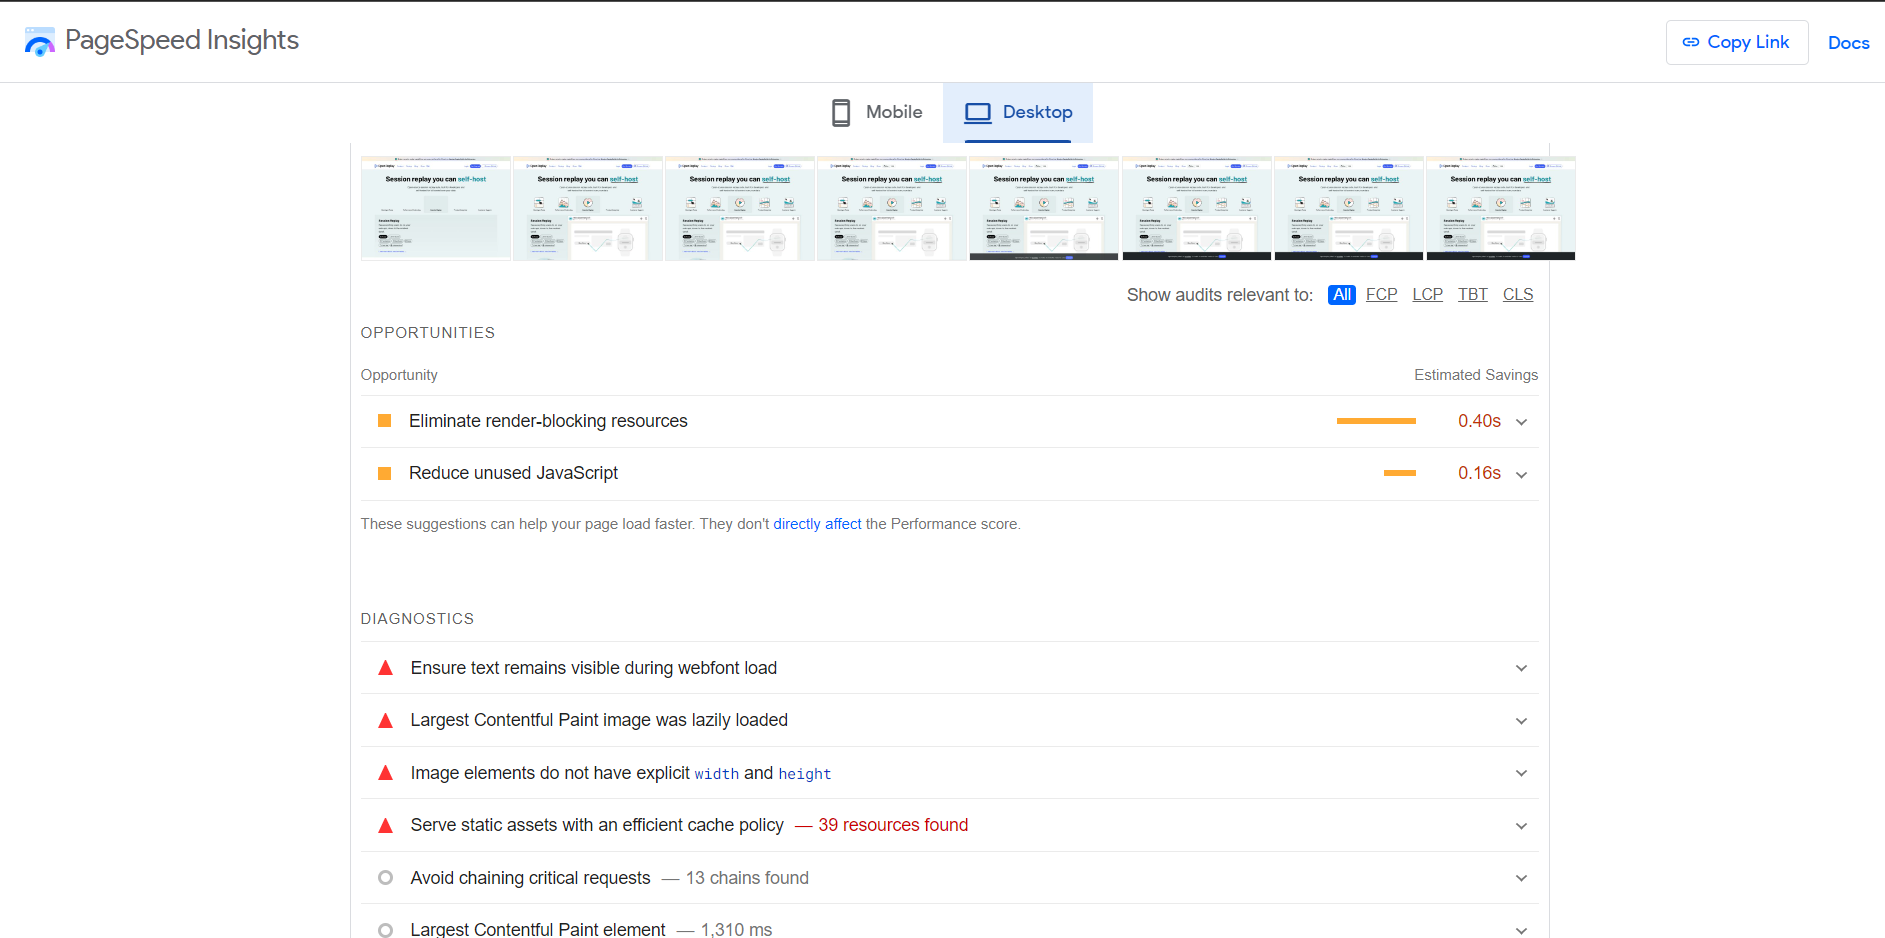
- Google PageSpeed Insights With Google PageSpeed Insights, you can evaluate a website’s performance. The tool analyzes a web page and generates a report recommending improving loading time and performance.
To better comprehend this, look at Open Replay’s insights using Google PageSpeed Insights.
-
These are the insights on the desktop.
-
These are the insights on mobile.
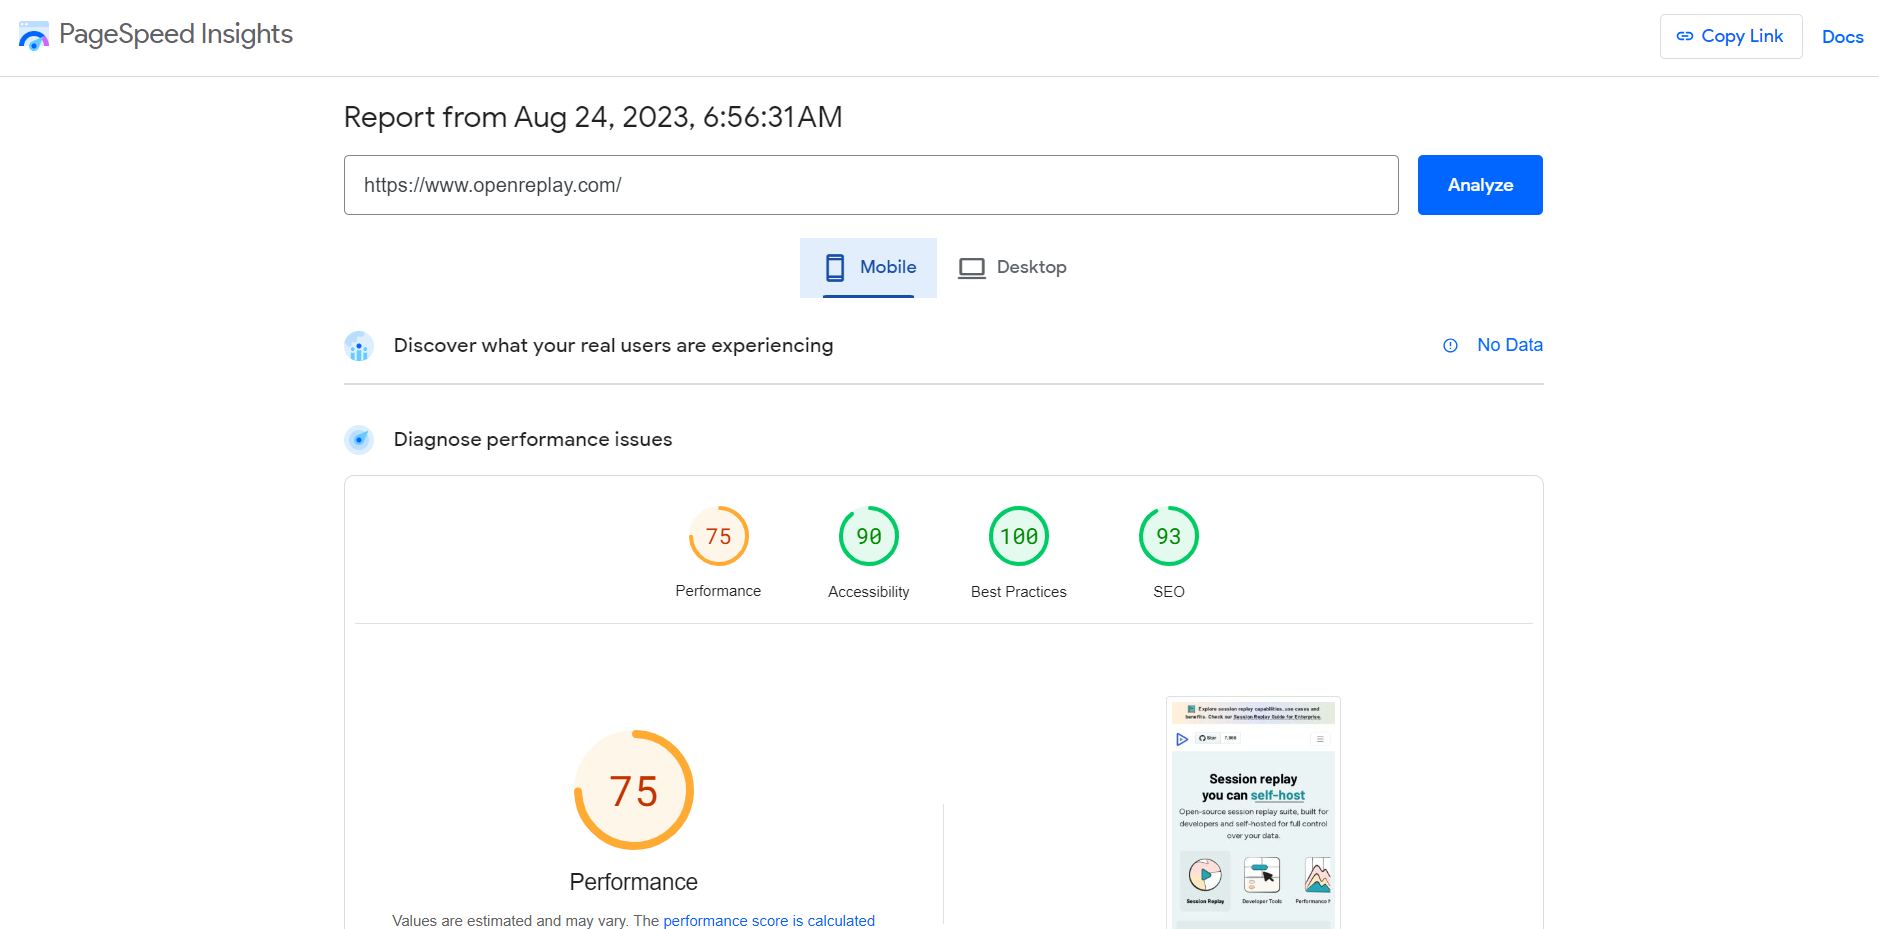
As seen in the images above, this evaluates elements, including website load speed, image optimization, and total blocking time. It offers a rating for the page’s desktop and mobile versions and detailed optimization advice.
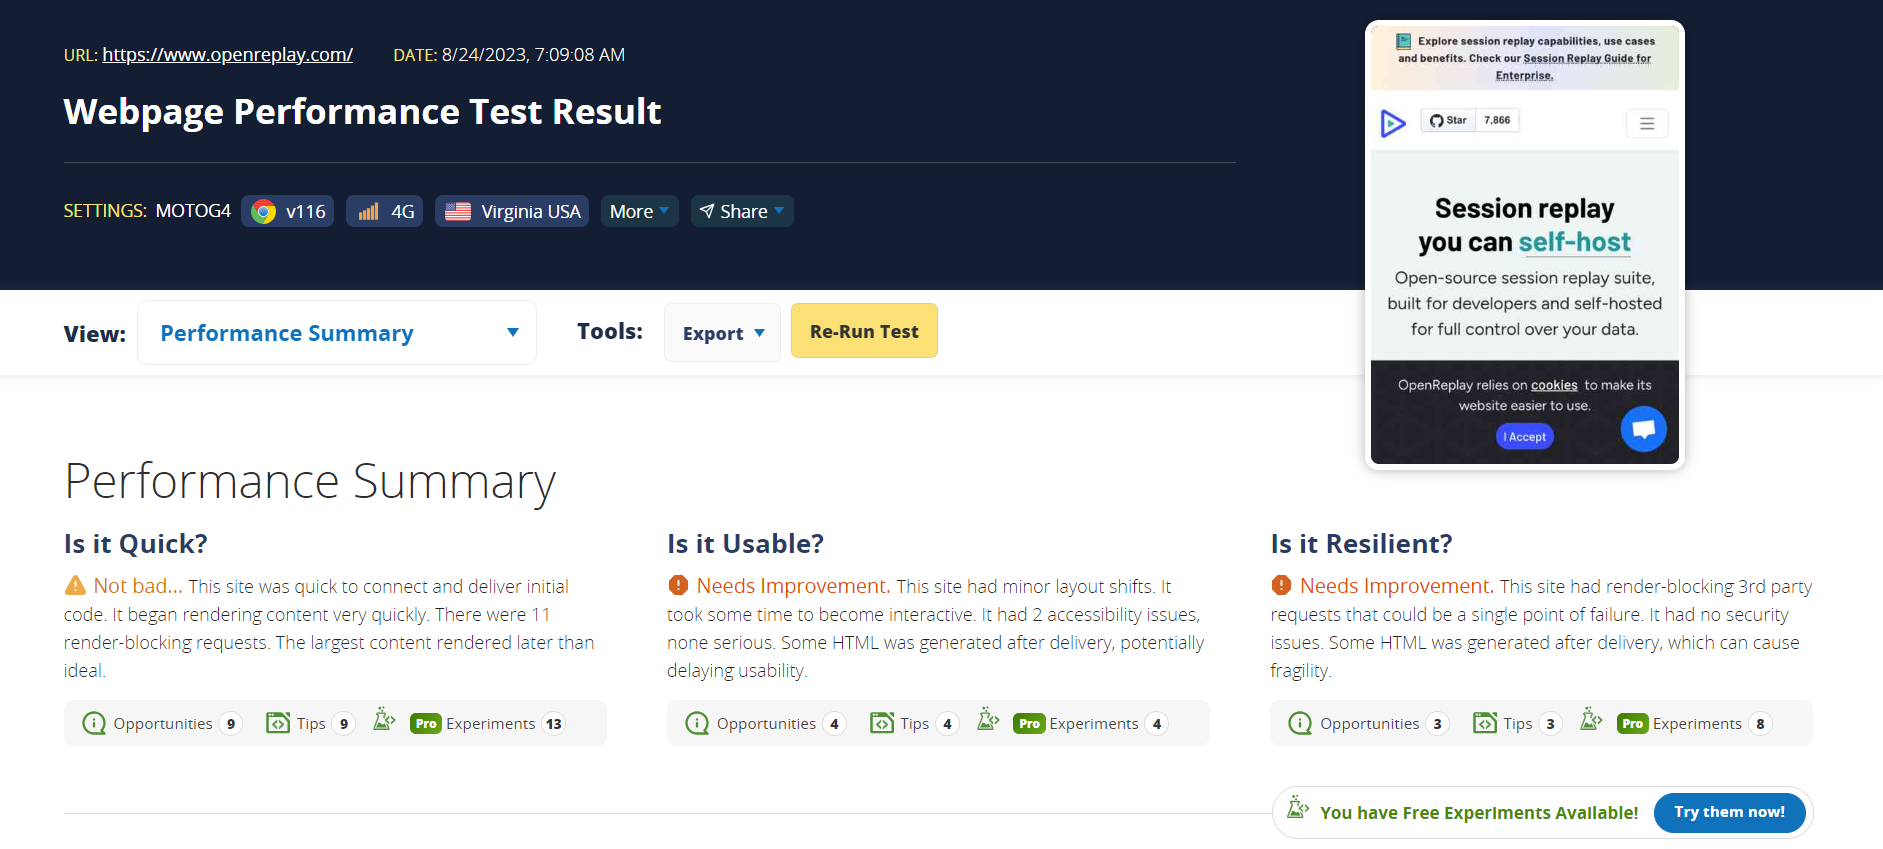
- WebPageTest This tool is similar to Google PageSpeed Insights. It lets you test the loading speed of a website across different devices, browsers, and locations.
Let’s analyze Open Replay’s website using WebPageTest:
-
This is the performance summary.
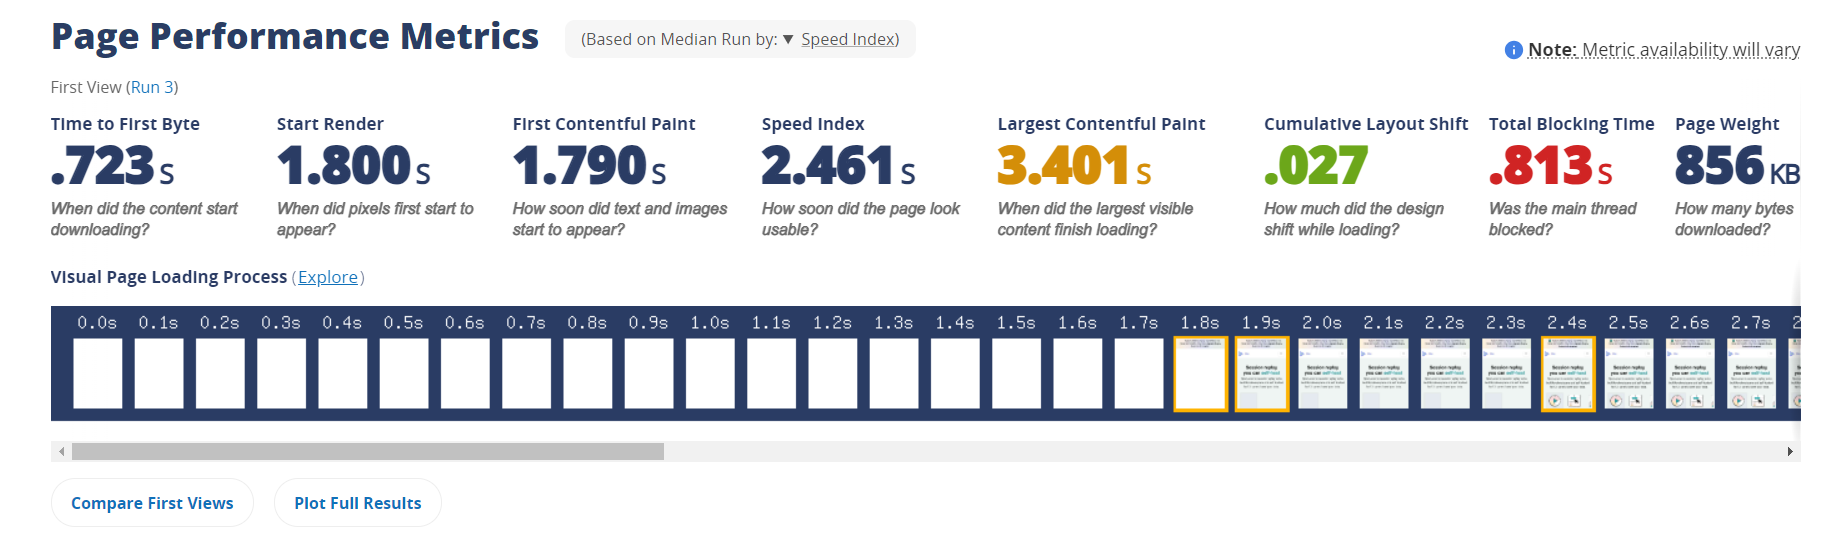
-
This is the page performance metrics.
-
This is the optimization summary.
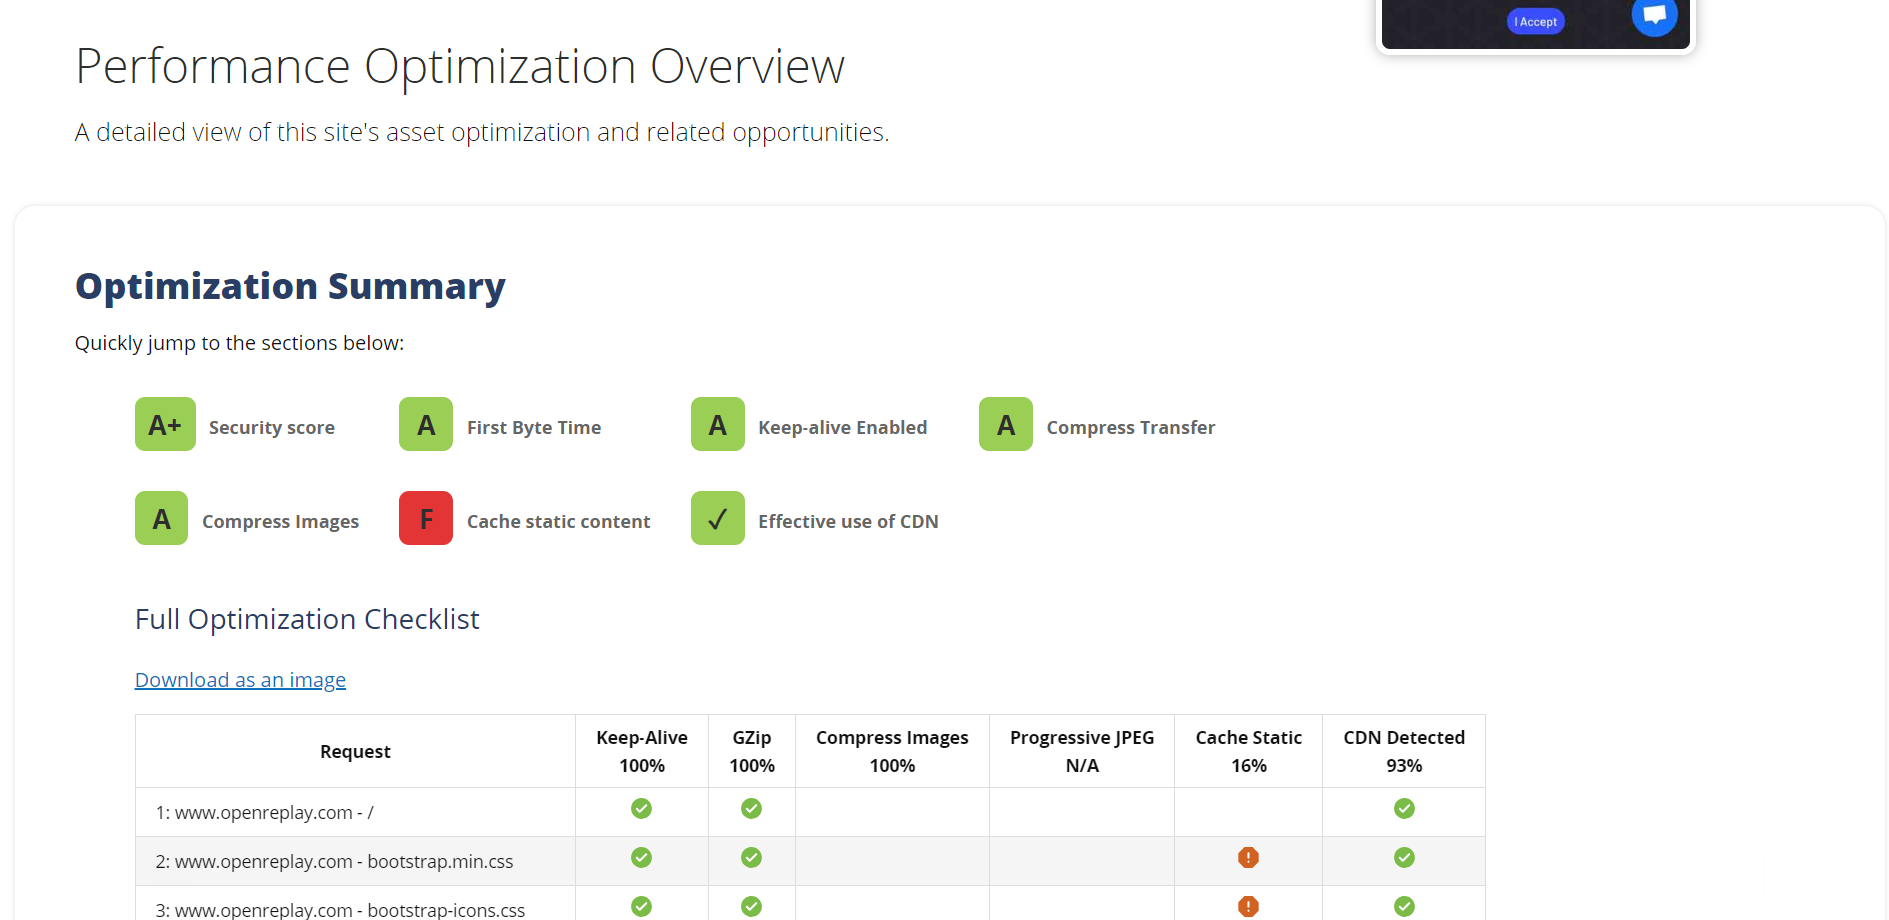
When looking at the Open Replay website on WebPageTest, it got off to a good start by connecting quickly and showing content fast, but 11 things were slowing it down.
Sometimes, things were added to the site after it should have been ready, which could make it a bit slower. Also, the website’s ability to handle problems could be better, as some outside things could break it.
- Chrome’s Developer Tools: Use the Chrome DevTools browser to determine where network activity and load times could be improved. The DevTools offer functions including network traffic analysis, JavaScript debugging, HTML, CSS, and JavaScript inspection and modification, and auditing for speed improvement.
Let’s analyze Open Replay’s website using Chrome’s Developer Tools.
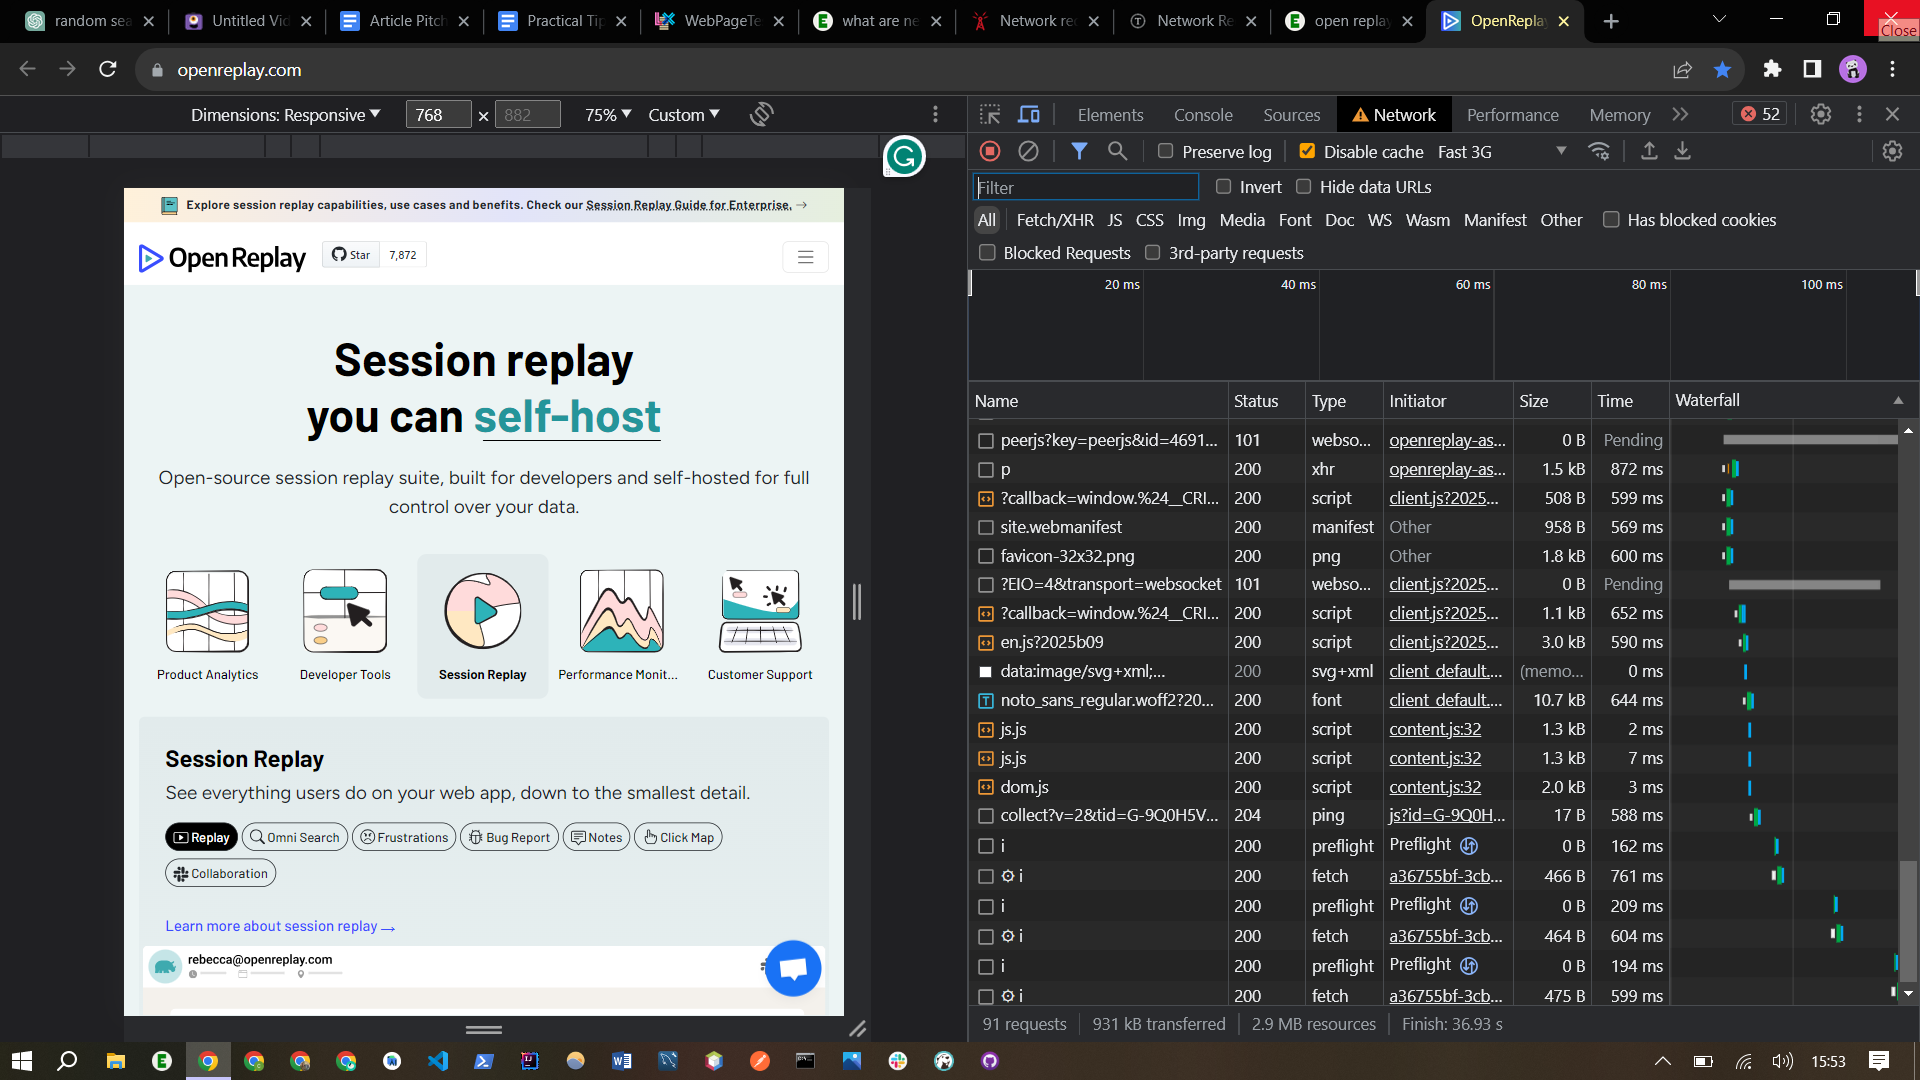
-
This is the network panel. All network activity is analyzed here.
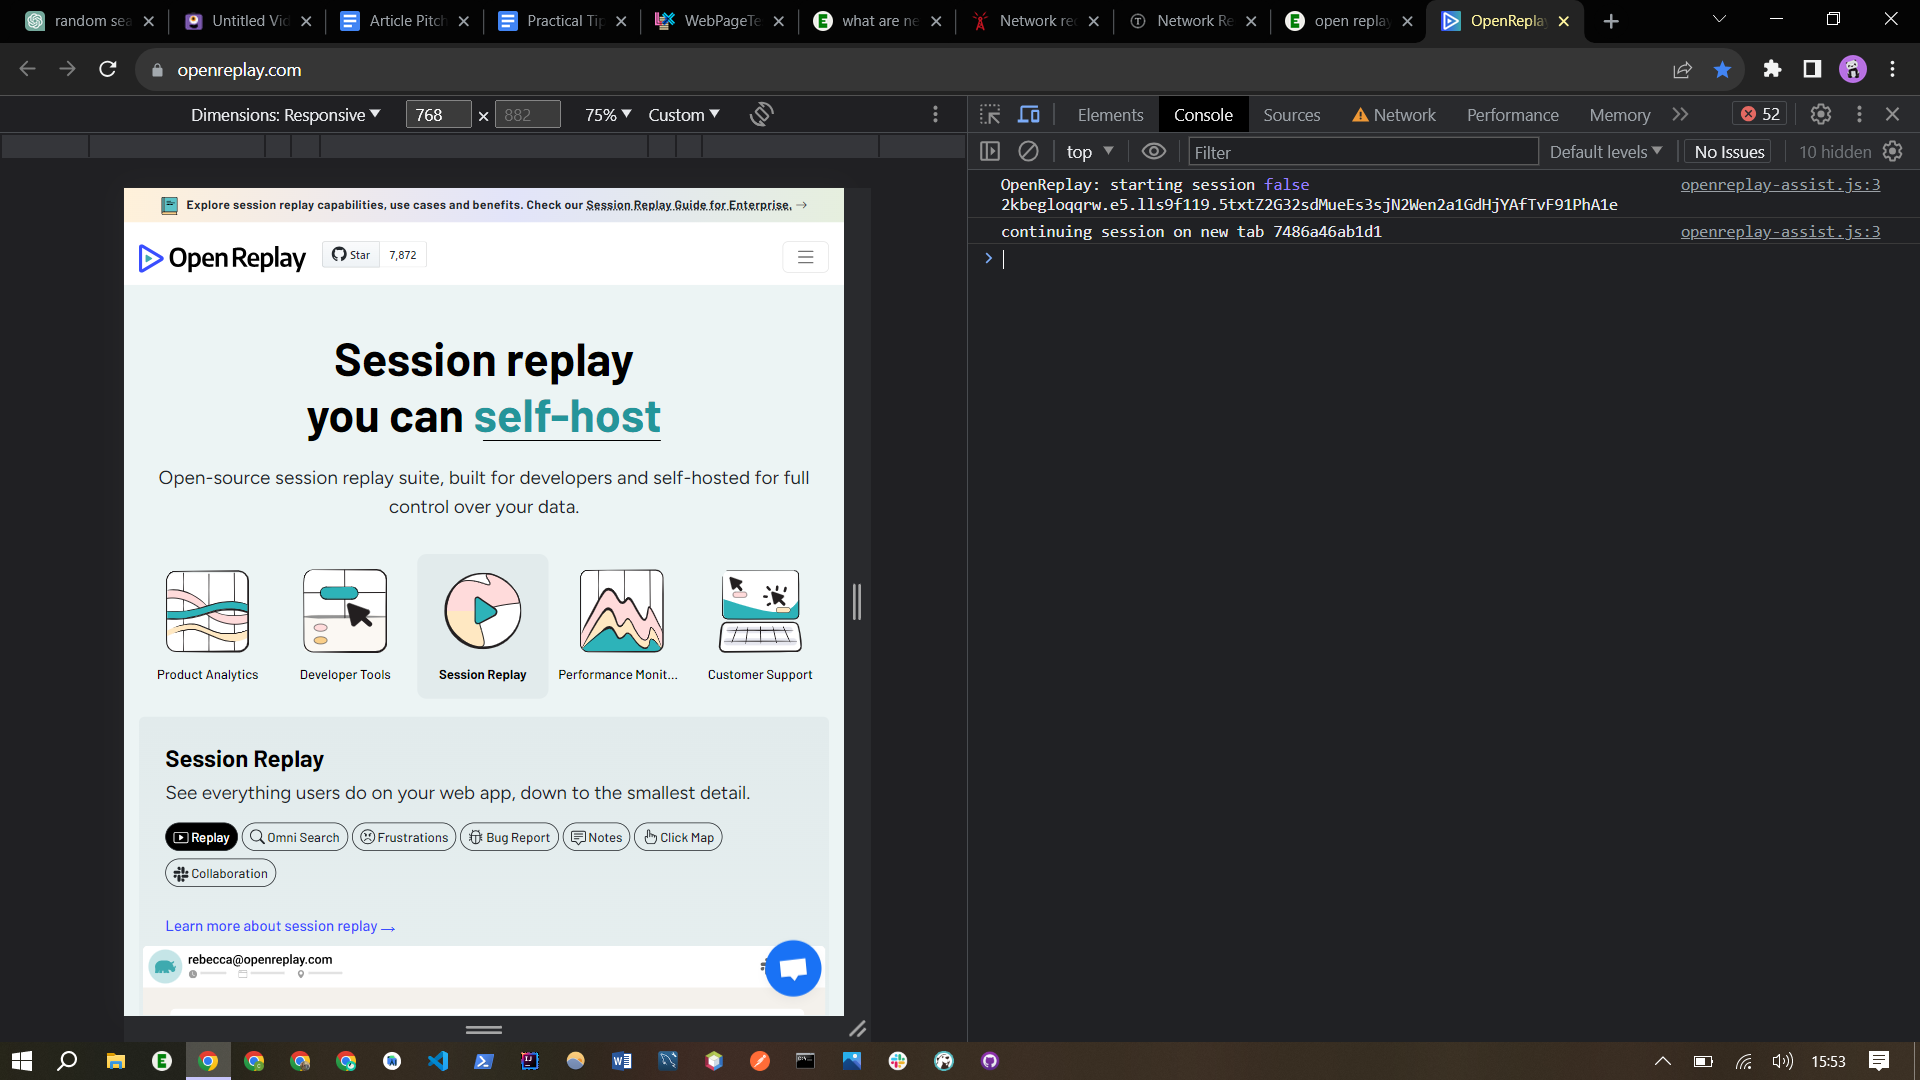
-
This is the console panel. This is where you can view and interact with JavaScript output and errors.
-
This is the elements panel. This panel is used for inspecting and manipulating the DOM (Document Object Model) of a web page.
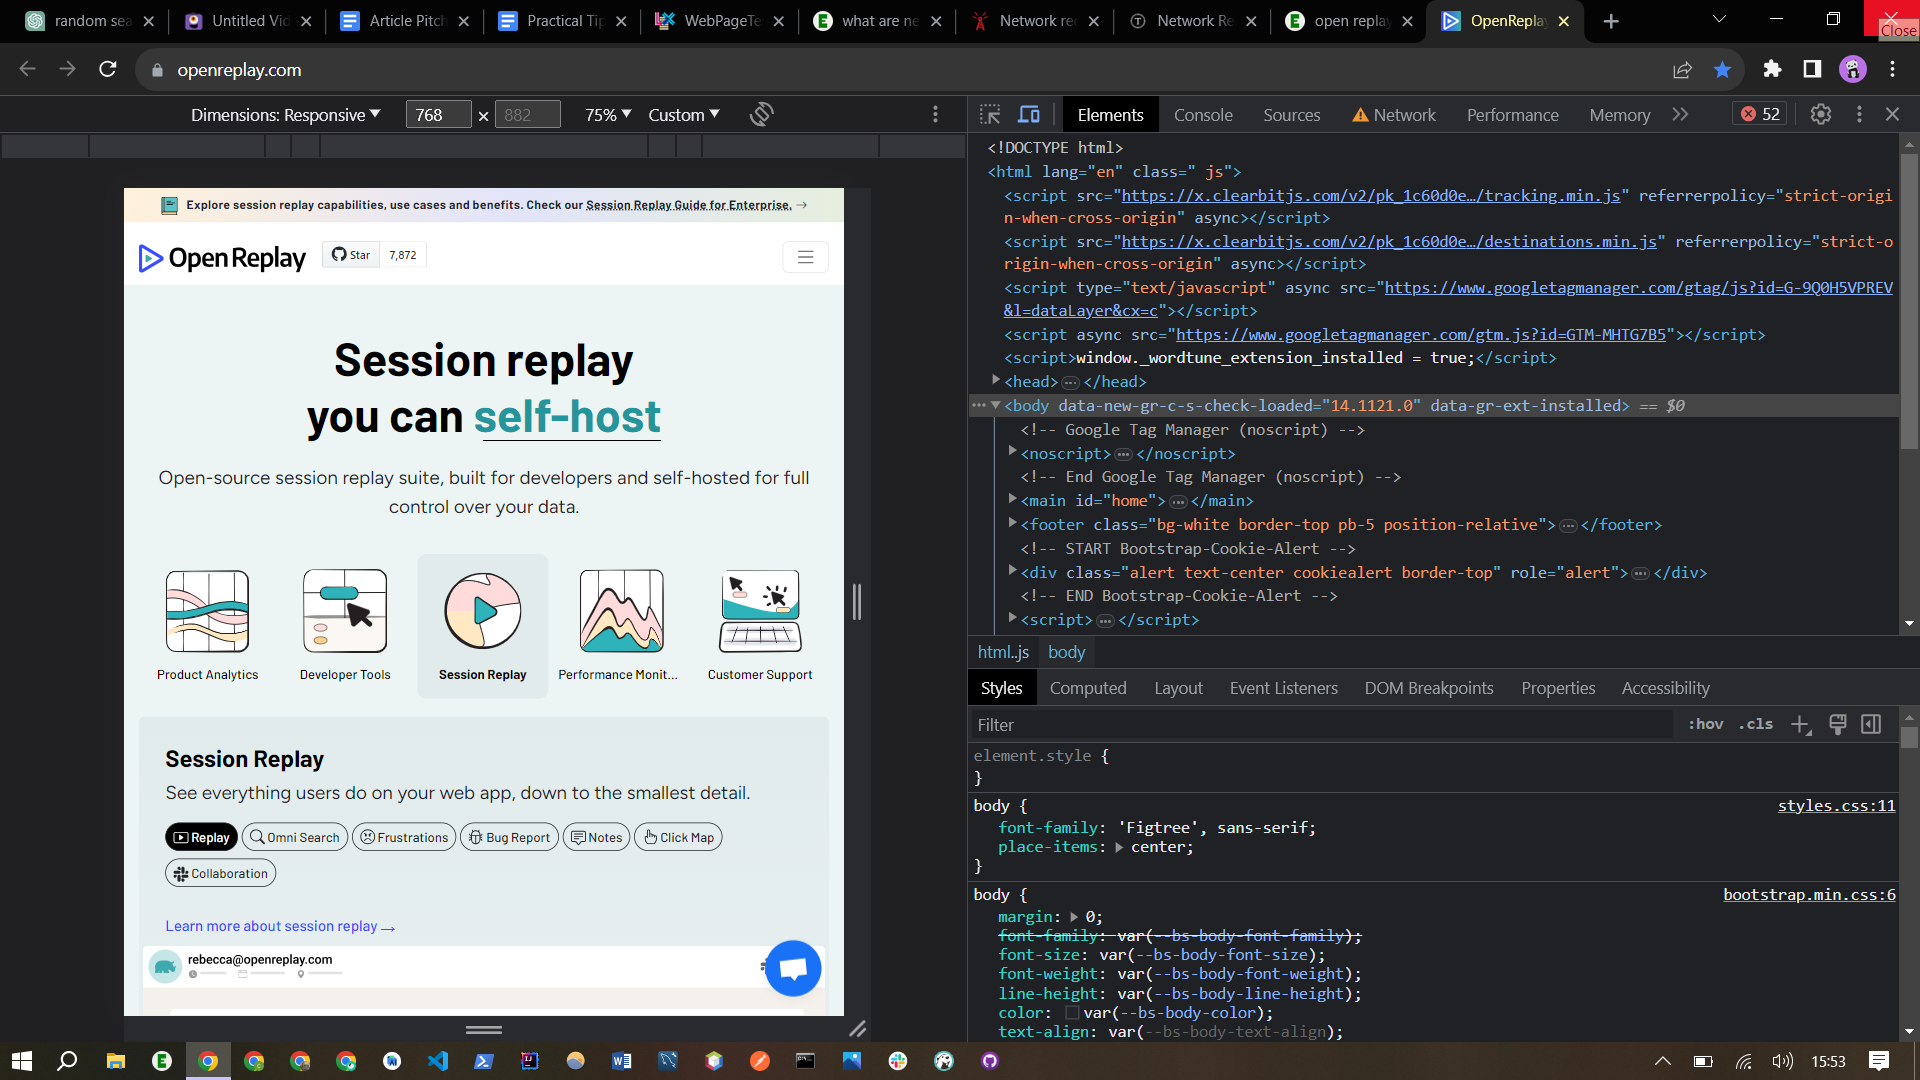
As seen in the images above, it allows testing different device views and screen sizes to ensure responsiveness.
With DevTools, developers can optimize their websites and make them faster and more efficient. The tool is available in the Chrome browser and can be accessed by pressing ‘Ctrl + Shift + I’ or ‘F12’ or by right-clicking on a web page and selecting “Inspect”.
Streamlining Front-End Assets
Front-end assets are simply a website’s visual and interactive elements that users see and interact with. These include CSS, JavaScript, and images. These significantly impact a website’s loading time.
Let’s look at how CSS, JavaScript, and images can affect web performance and how they can be optimized.
CSS
CSS may look innocent, but it plays a vital role in the performance of a website. As a result, pages take longer to render and load due to external CSS files, which must be fetched and processed before rendering. Large CSS files worsen this by increasing download times, especially on slower connections.
To streamline CSS, there are a few techniques that can be used:
- Minify CSS: Minification is the process of removing extra and unnecessary parts of a code, such as whitespace, characters, line breaks, comments, and unnecessary semi-colons in the source code to reduce its file size. As a result, a website loads more quickly because there is less code.
Consider the following CSS code:
p {
  font-family: arial;
  color: green;
  background-color: white;
}

/* links */

a:link {
  color: blue;
}

a:visited {
  color: white;
}
In the following code, you may have noticed the spaces, indents, comments, etc. While these things make the code more readable to us, the browser doesn’t need any of these to run the code efficiently. When parsing the files, it ignores them.
This is where we minify the CSS code. It’ll remove the extra/unnecessary code, resulting in a smaller CSS file, which in turn makes the website load faster. Minifying CSS can be done in several ways, which include:
- Shortening variable names.
- Deleting redundant information.
- Using an online minifying tool such as CSS Minifier.
Here is what the CSS example above looks like after minifying the code:
p{font-family:arial;color:green;background-color:white;}a:link{color:blue;}a:visited{color:white;}- Make CSS external: Creating an external CSS file has many benefits. One of these includes faster loading speeds because each relevant page just needs to have the CSS file downloaded first and applied as necessary.
To create an external CSS file:
<head>
  <link rel="stylesheet" type="text/css" href="style.css" />
</head>
JavaScript
With client-side scripting in JavaScript, applications may be more dynamic and interesting. JavaScript that is overused or that isn’t optimized well, however, can seriously harm performance. Performance issues with JavaScript can be attributed to several factors:
- The code is unorganized.
- You have too many dependencies that are poorly managed.
- There are too many unnecessary loops or calls within loops.
You can increase JavaScript performance by following these recommended practices:
Minimize DOM access: A big DOM tree can slow down your website in various ways, including slower download time and rendering. By minimizing the amount of DOM operations, performance can be considerably improved. You can accomplish this by storing DOM elements in variables and accessing them as needed.
// Poor practice
document.getElementById("element").style.color = "purple";
document.getElementById("element").style.fontSize = "116px";

// Best practice
const element = document.getElementById("element");
element.style.color = "purple";
element.style.fontSize = "116px";
Remove duplicate scripts: This is as simple as it sounds. When creating scripts, eliminate the possibility of duplicate scripts. This can be done by checking the existing scripts before creating a new one. If a similar script already exists, it can be modified or reused instead of creating a duplicate.
Images
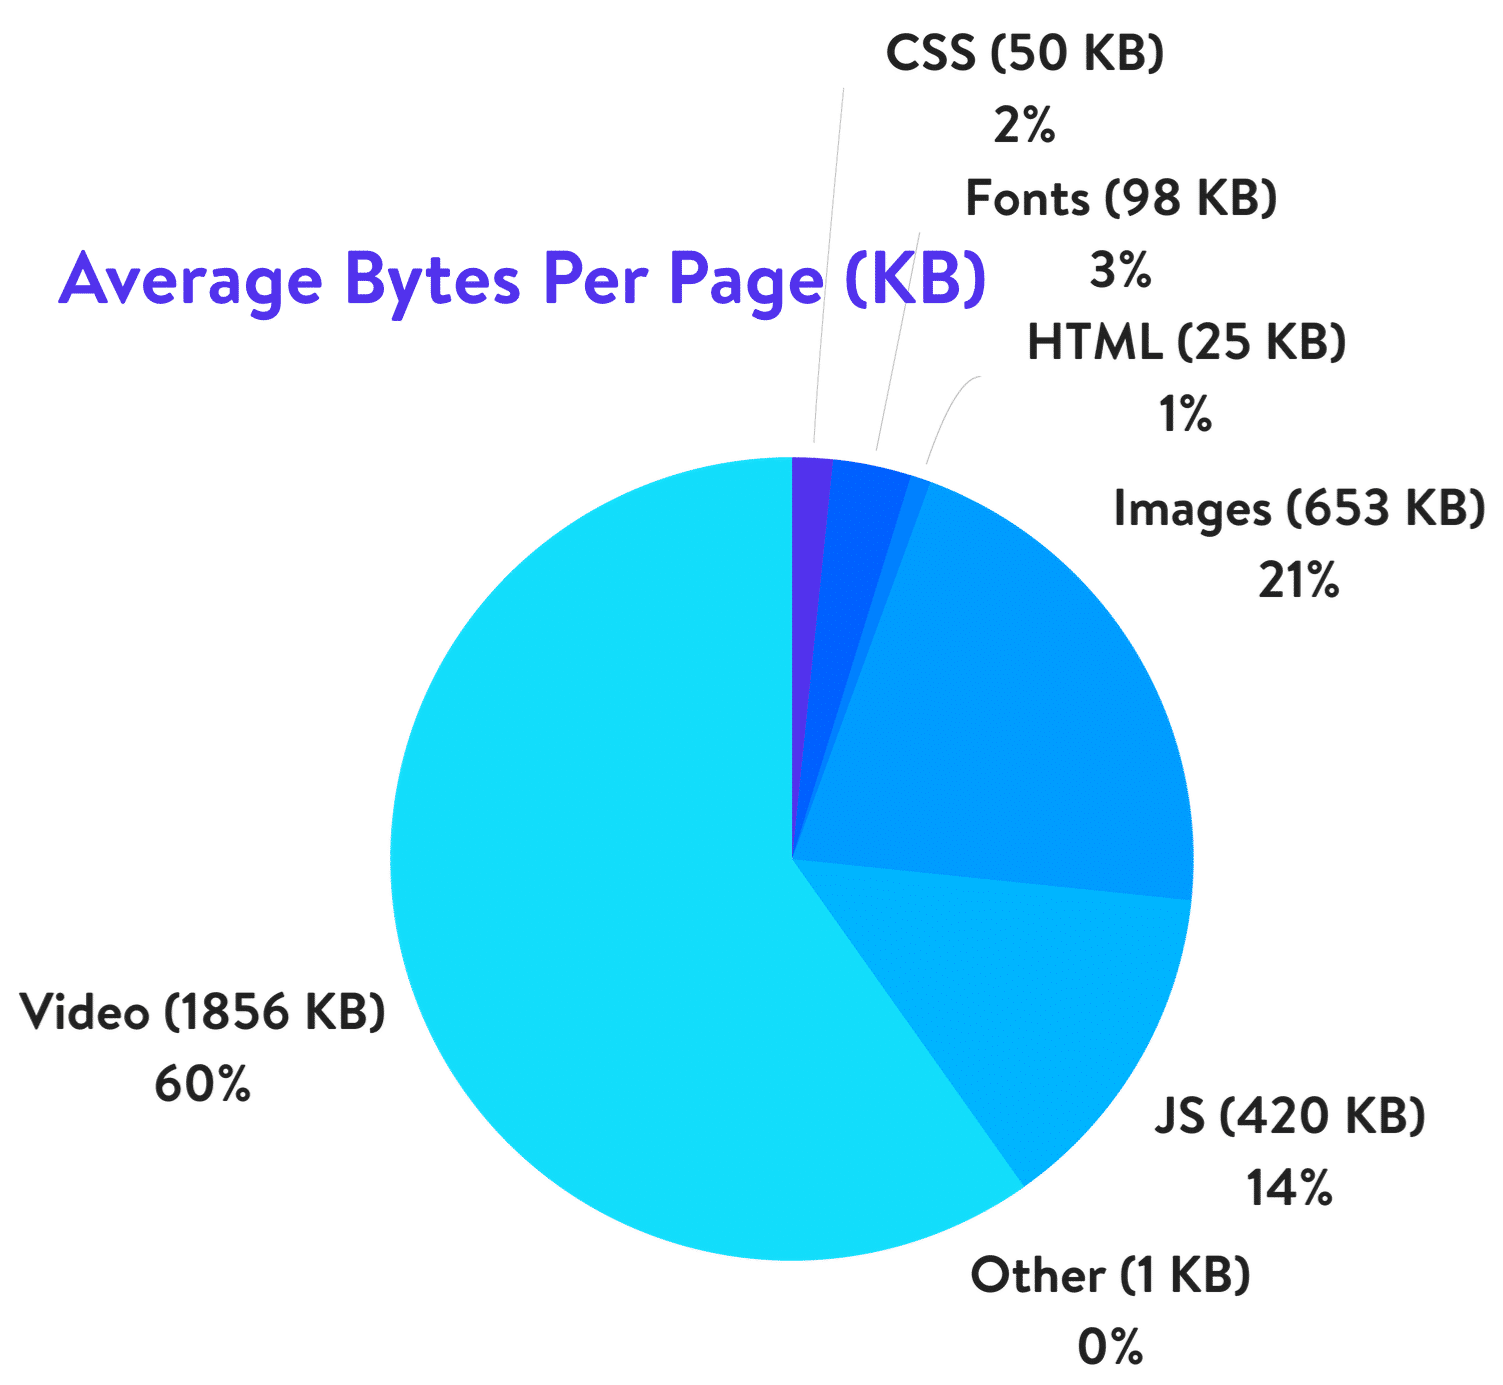
According to HTTP Archive, as of November 2018, images make up to 21% of a total webpage’s weight. Additionally, according to Google in 2018, compressing images and text, 25% of pages could save more than 250kB and 10% can save more than 1MB (which contributes to page load times). After videos, images should be the first place you begin optimizing your website.
As developers and designers (incredibly cutthroat UI/UX designers who just love animations), we want the best animations to enhance our websites. Well, here’s a fun fact for you: Did you know that according to Unbounce, 2019, of all the people surveyed, half said they’d be willing to give up animation and video for faster load time?
This is not to say that we shouldn’t strive to provide a visually appealing user experience. We definitely should, but we should also prioritize functionality and usability. A beautiful design is meaningless if users can’t navigate the site seamlessly.
To improve image optimization, you can consider the following:
- Lazy-loading images: The term “lazy loading” relates to asynchronous picture loading on a webpage. Lazy loading of images improves efficiency by reducing the initial page load time, initial page weight, initial page rendering, and system resource utilization.
JavaScript techniques such as LazyLoad, Lozad.js, or Intersection Observer can be used to accomplish lazy image loading. Rather than loading all photos at once, these libraries let you load images only when they are in or near the viewport.
- Make favicon.io small and cacheable: Making favicon.io small and cacheable involves optimizing the favicon.ico file and configuring the caching settings on your server. To make the favicon.io file smaller, you can use image optimization tools like ImageOptim or TinyPNG to compress the image without sacrificing quality. This will reduce the file size and improve the loading speed of your website.
Enhancing Server-Side Performance
Everything that happens on a server is referred to as server-side. Many large-scale applications rely heavily on server-side computing to handle database queries, authentication, and data processing tasks. This data is dynamically sent to the client by the server.
There are various ways to enhance server performance. These include enabling caching and using a Content Delivery Network.
Let Franka briefly explain the concept of caching.

By permitting caching, the server may receive and distribute data more quickly than if it had to process it from scratch, increasing server-side speed.
Another way we can improve server performance is by using a Content Delivery Network (CDN). A CDN is a network of geographically dispersed computers that caches and delivers web information to users according to their location.
Here is additional information about CDNs from Franka.
Summary
If there’s one thing this article taught me about optimizing website performance, it’s that there are several areas to focus on, including CSS, JavaScript, images, and server-side performance. Minifying CSS code can significantly reduce file size and improve load times. Creating external CSS files helps with faster loading speeds. Optimizing JavaScript involves minimizing DOM access and removing duplicate scripts.
Image optimization is crucial, and lazy-loading images can improve efficiency. Making the favicon. io file small and cacheable is also important. Lastly, server-side performance plays a critical role in handling database queries and data processing tasks. Overall, prioritizing functionality and usability is key to providing a great user experience.
Gain control over your UX
See how users are using your site as if you were sitting next to them, learn and iterate faster with OpenReplay — the open-source session replay tool for developers. Self-host it in minutes, and have complete control over your customer data.
Star on GitHub12k