10 must-have tools for Front End Developers
Learn the top 10 tools you should be using for web development


As a front-end developer, you constantly look for ways to optimize your workflow and streamline your development process. One of the most powerful tools at your disposal is the browser’s dev tools; with the proper dev tools, you can debug, inspect and test your code without much stress. In this article, you will be introduced to 10 must-have browser dev tools that every front-end developer should be familiar with; from the basic elements inspector to advanced performance analysis tools, these tools will help you work faster and more efficiently.
1: Chrome DevTools
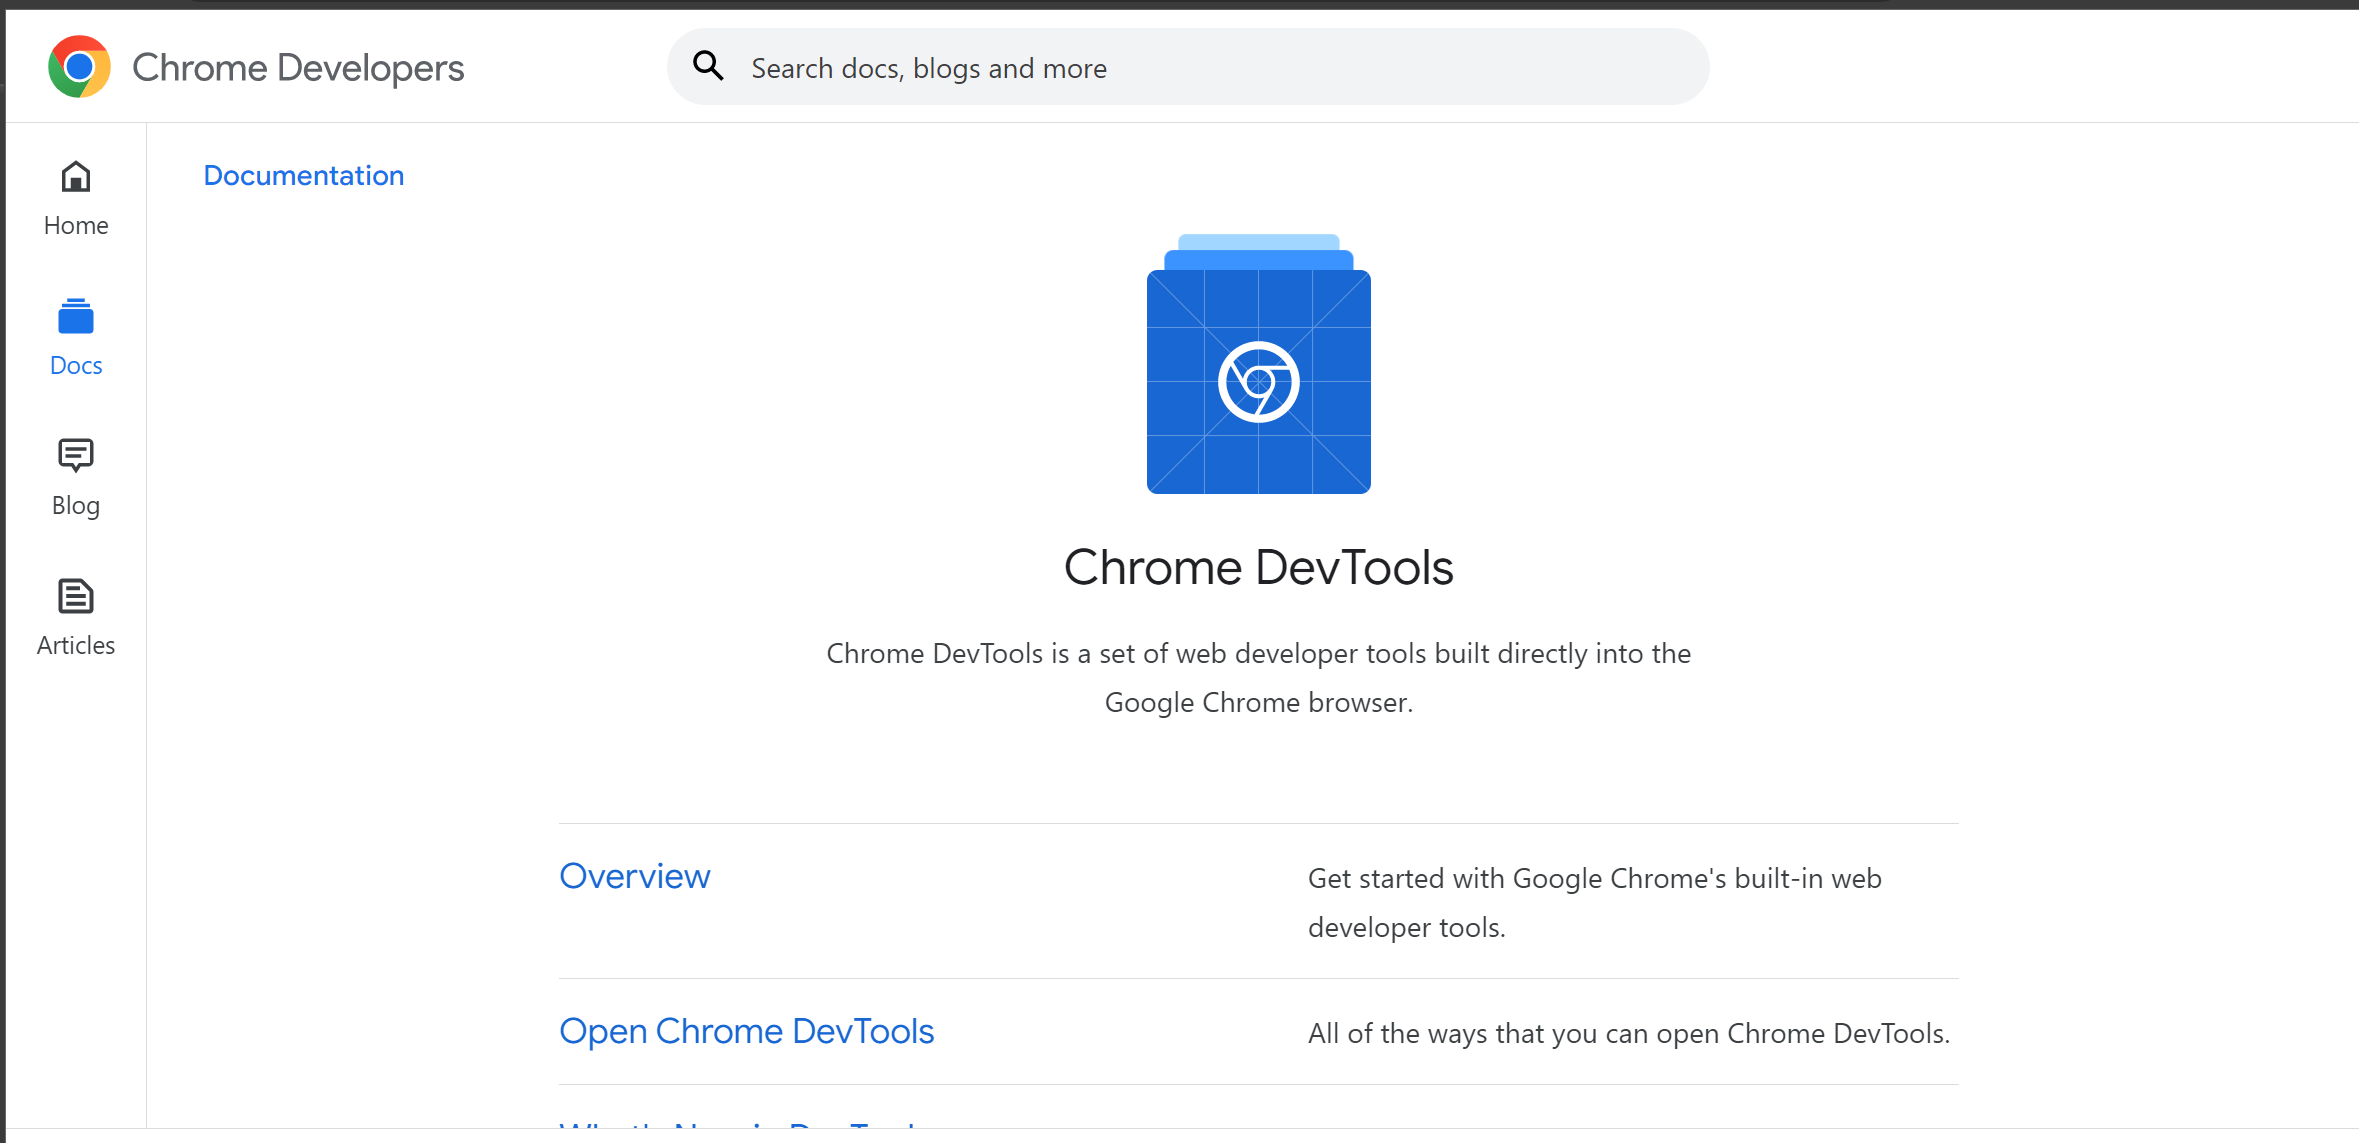
Google Chrome’s Devtools is a web development tool built directly into the Chrome browser. It provides developers with a vast range of features that can be used for debugging, testing, optimizing websites, etc.
Here are the key features of Chrome DevTools:
-
Inspection and editing of HTML and CSS: Chrome DevTools inspects and edits the HTML and CSS of a web page, enabling them to quickly identify and fix issues related to layout, styling, and content.
-
JavaScript debugging: Chrome DevTools uses the JavaScript debugger to step through code, set breakpoints, and evaluate expressions, making it easier to identify and fix bugs in their code.
-
Network analysis: Chrome DevTools provides detailed information about network requests made by a web page, including timings, headers, and response data, allowing developers to optimize network performance and troubleshoot issues.
-
Performance analysis: Chrome DevTools includes a performance profiling tool suite that enables developers to identify performance bottlenecks and optimize web page loading times.
-
Mobile emulation: Chrome DevTools includes a mobile device emulator allowing developers to test how their web pages look and function on different devices, including smartphones and tablets.
-
Accessibility audits: Chrome DevTools includes an accessibility auditing tool that helps developers ensure that their web pages are accessible to users with disabilities.
-
Console logging: Chrome DevTools includes a JavaScript console that developers can use to log messages, debug code, and execute commands.
These features make Chrome DevTools an indispensable tool for front-end developers, helping them improve their websites’ quality and performance.
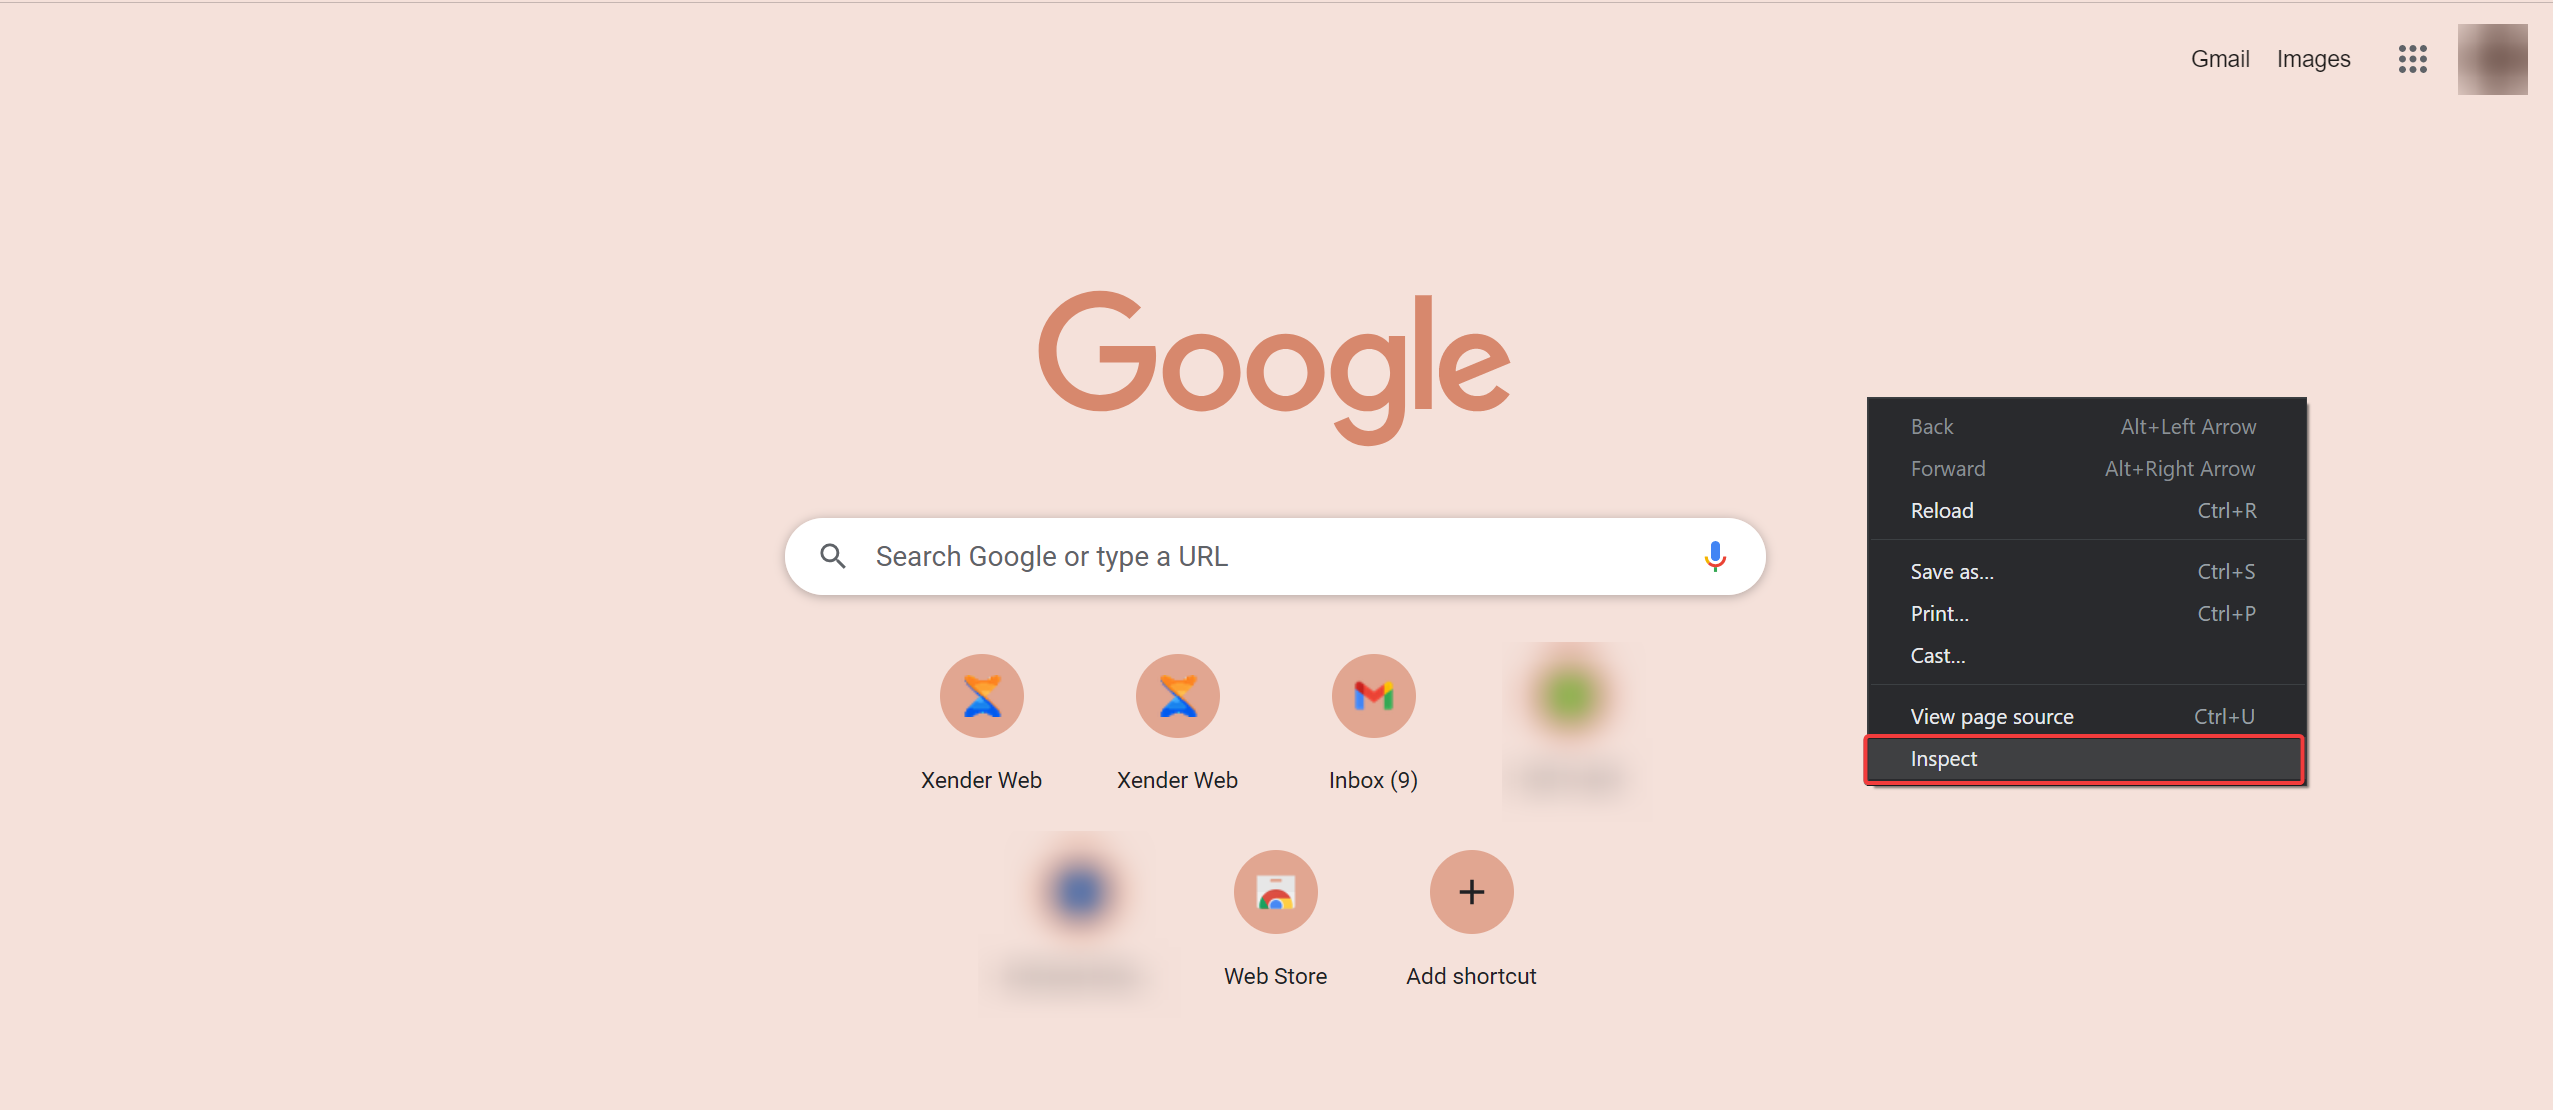
The following steps can access Google Chrome DevTools:
-
Right-click on a Google Chrome tab and click on Inspect.
-
A pop-up would appear, discovering all available panels that can aid debugging. It is usually on the left side, but you can adjust yours to any side of the screen.
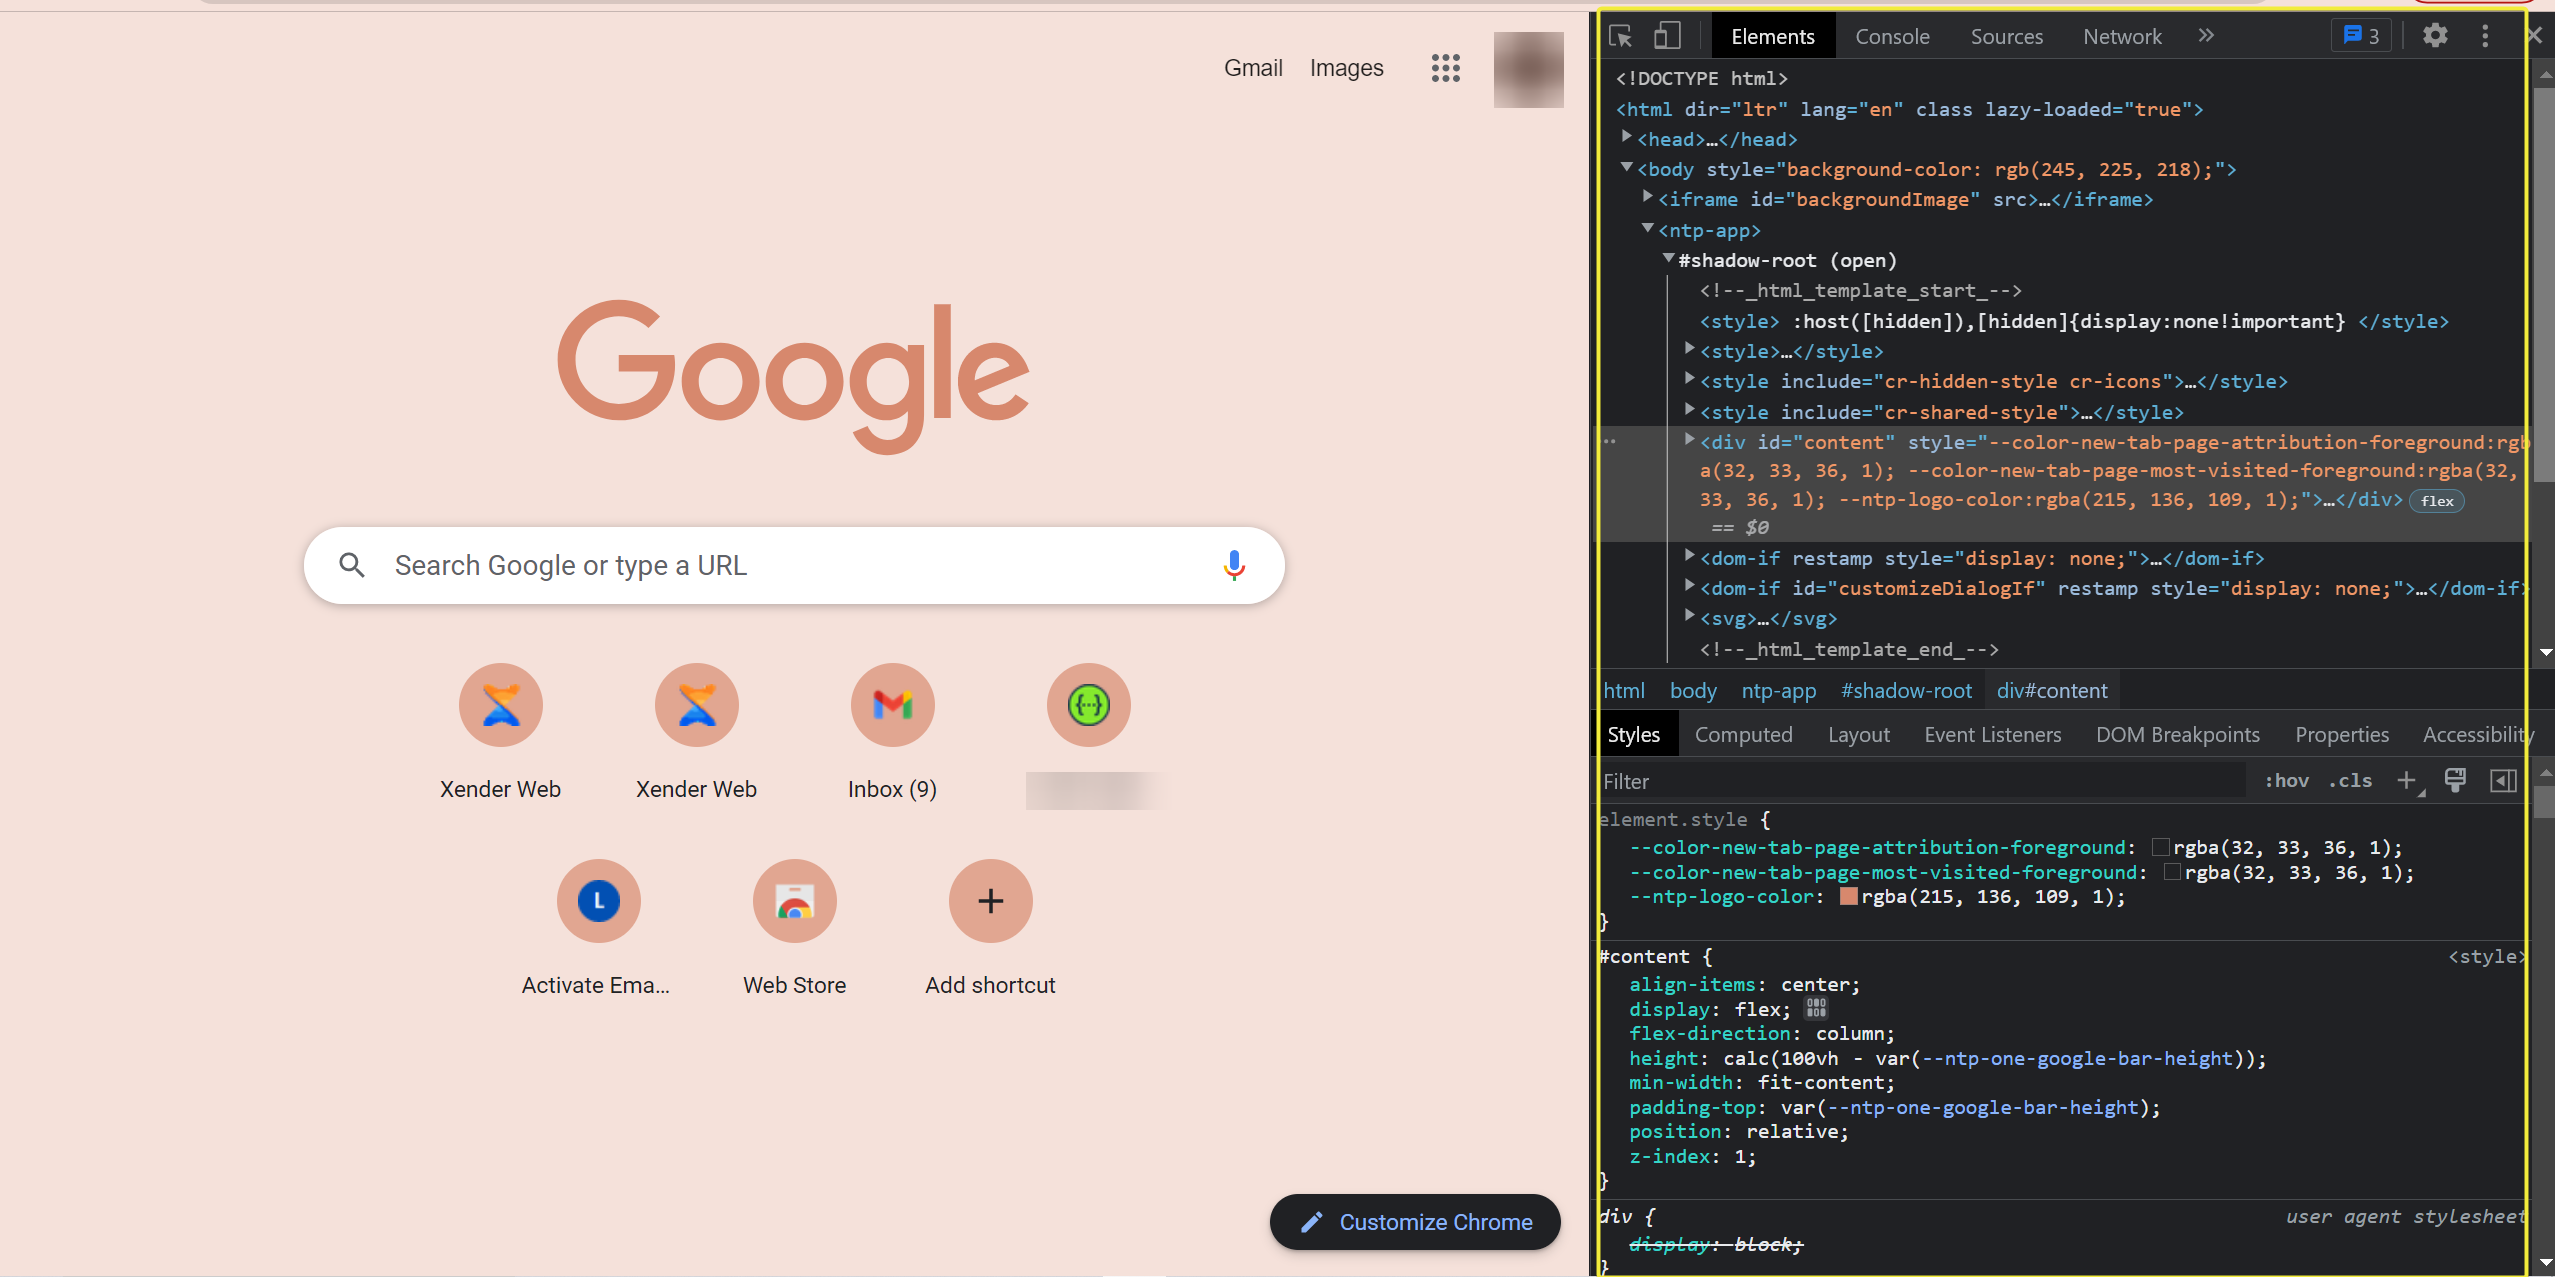
Once you access this pop-up, you can debug your front-end applications.
2: Telerik Fiddler
Telerik Fiddler is a free web debugging proxy tool that can help you inspect and debug HTTP traffic between a web application and a server. Fiddler is designed to help developers identify and troubleshoot web application issues by providing detailed information about network traffic, HTTP headers, response codes, and more. When using a proxy tool, your client device sends its network traffic to the proxy server, which then forwards the request to the intended server.
With Fiddler, you can easily view, capture and modify HTTP traffic, including requests and responses, from your web browser or any other HTTP application. Also, Fiddler simulates slow network conditions, tests the security of your web application, and even automates tasks with its powerful scripting capabilities.
Here are the key features of Fiddler:
-
Traffic Capturing and Analysis: Fiddler captures and analyses all HTTP and HTTPS traffic between the client and the server, allowing you to view well-detailed information about requests, responses, headers, and more.
-
Requests and Response Modification: Fiddlers allow the modification of HTTP requests and responses, which is helpful for testing and debugging applications.
-
Performance Profiling: Fiddler has performance profiling tools that help identify and resolve performance issues in web applications by providing detailed information about load times, caching, and more.
-
Scripting: Fiddler has powerful scripting capabilities that allow you to automate tasks and customize a tool’s behavior to meet a specific need.
-
Breakpoints and Inspectors: Fiddler has a range of tools that makes t easy to get breakpoints and inspect network traffics, including HTTTP/HTTPS request and response inspector and breakpoint editor.
-
Session Manipulation: Fiidler supports the manipulation of web sessions which helps test user authentication and session handling in web applications.
Proxy Fiddler Tool is supported on Windows OS, MacOS, and Linux. You can download it here. Although this tool has different plans, you can check them out here. You can get a demo of the tool here.
3: Axe accessibility tools
Axe is home to accessibility testing tools that aid developers in identifying and fixing accessibility issues on their web applications. It offers many tools, including browser tensions which support Firefox, Chrome, and Edge browsers. Also, it has an npm package that can be used in automated testing and an API for integration with testing tools. The tools analyze a web application’s HTML and CSS code and the Javascript codebase to identify accessibility issues.
Axe provides a guide on how to resolve the issue it finds, making it a useful tool for the developer who is new to accessibility best practices. This tool can detect missing alternative text for images, invalid color contrast, missing or incorrect Accessible Rich Internet Applications (ARIA) attributes, and accessibility issues on the keyboard.
Here are the key Features of Axe accessibility:
-
Guided testing: Axe always provides guidance on how to fix issues it finds. This guidance could be in code snippets or text on best practices.
-
Integration with other tools: Axe can be integrated with tools such as JIRA, GitHub, Jenkins, and lots more. This makes it easy for developers to use accessibility testing in their existing workflows.
-
Custom rules: Axe allows custom rules using Axe’s API. This lets developers test for specific accessibility issues not covered by Axe’s default or built-in rules.
-
Browser Extension: Axe supports browser extensions for Chrome and Firefox, and it allows developers to run accessibility tests on web pages that they visit. This extension has an easy-to-use interface for running tests and viewing the results.
-
Automated testing: Axe offers an npm package for automated testing of web applications. Developers can integrate AXe with testing frameworks such as Jest and run automated accessibility tests on their applications as part of their continuous integration and delivery process.
You can get a free trial of Axe here and request a demo before you purchase it here. Also, you can check out the Chrome extension here.
4: Lighthouse For Google Chrome
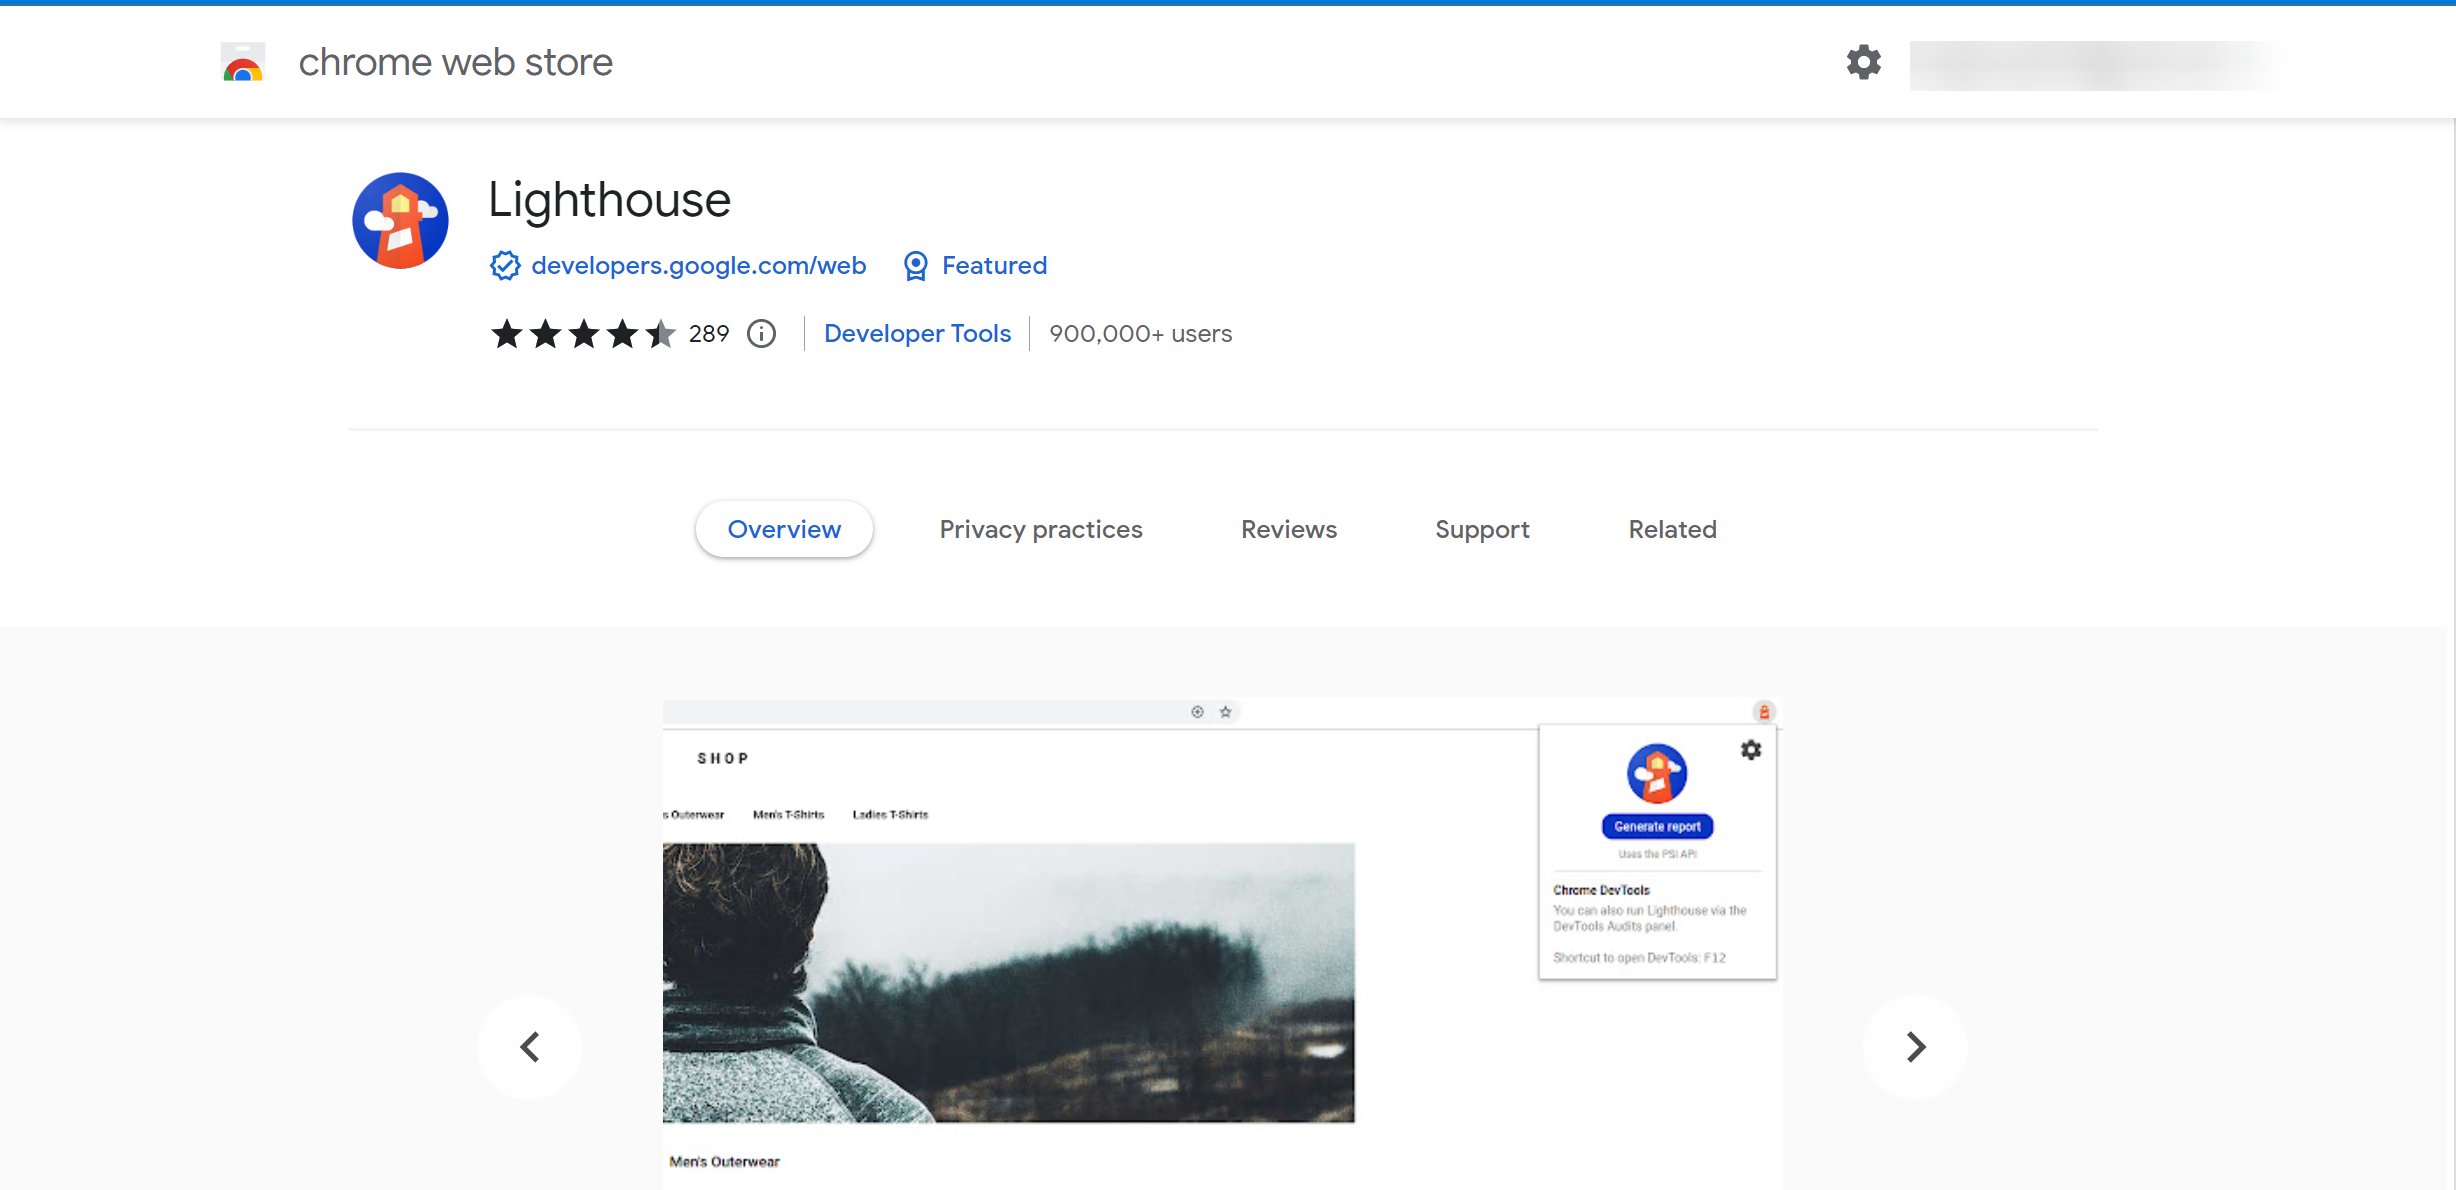
Lighthouse is an open-source Chrome extension used to improve the performance and quality of your web apps. Regardless of being built by Google, it is also available as a Firefox browser extension and a NodeJS command-line tool.
Here are the key Features of Lighthouse:
-
Best practices testing: Lighthouse tests a website or a web application’s compliance with best practices, including the use of HTTPS, compatibility with different browsers, and mobile-friendliness, and offers suggestions for improving the website’s metrics.
-
Search Engine Optimization(SEO) testing: Lighthouse tests a website’s accessibility, color contrast, meta tags, headings, etc., and offers suggestions for improving its search engine ranking.
-
Performance testing: Lighthouse offers website performance testing, which includes testing load time, page speed, and responsiveness, and it offers suggestions to optimize the metrics of websites.
-
Accessibility testing: Lighthouse tests webpages, websites, and web applications’ accessibility, such as color contrast, alternative text for images, etc.
-
Custom Audits: Lighthouse allows developers to create custom audits for a specific metric or function they wish to test using javascript and Lighthouse API.
5: BrowserStack
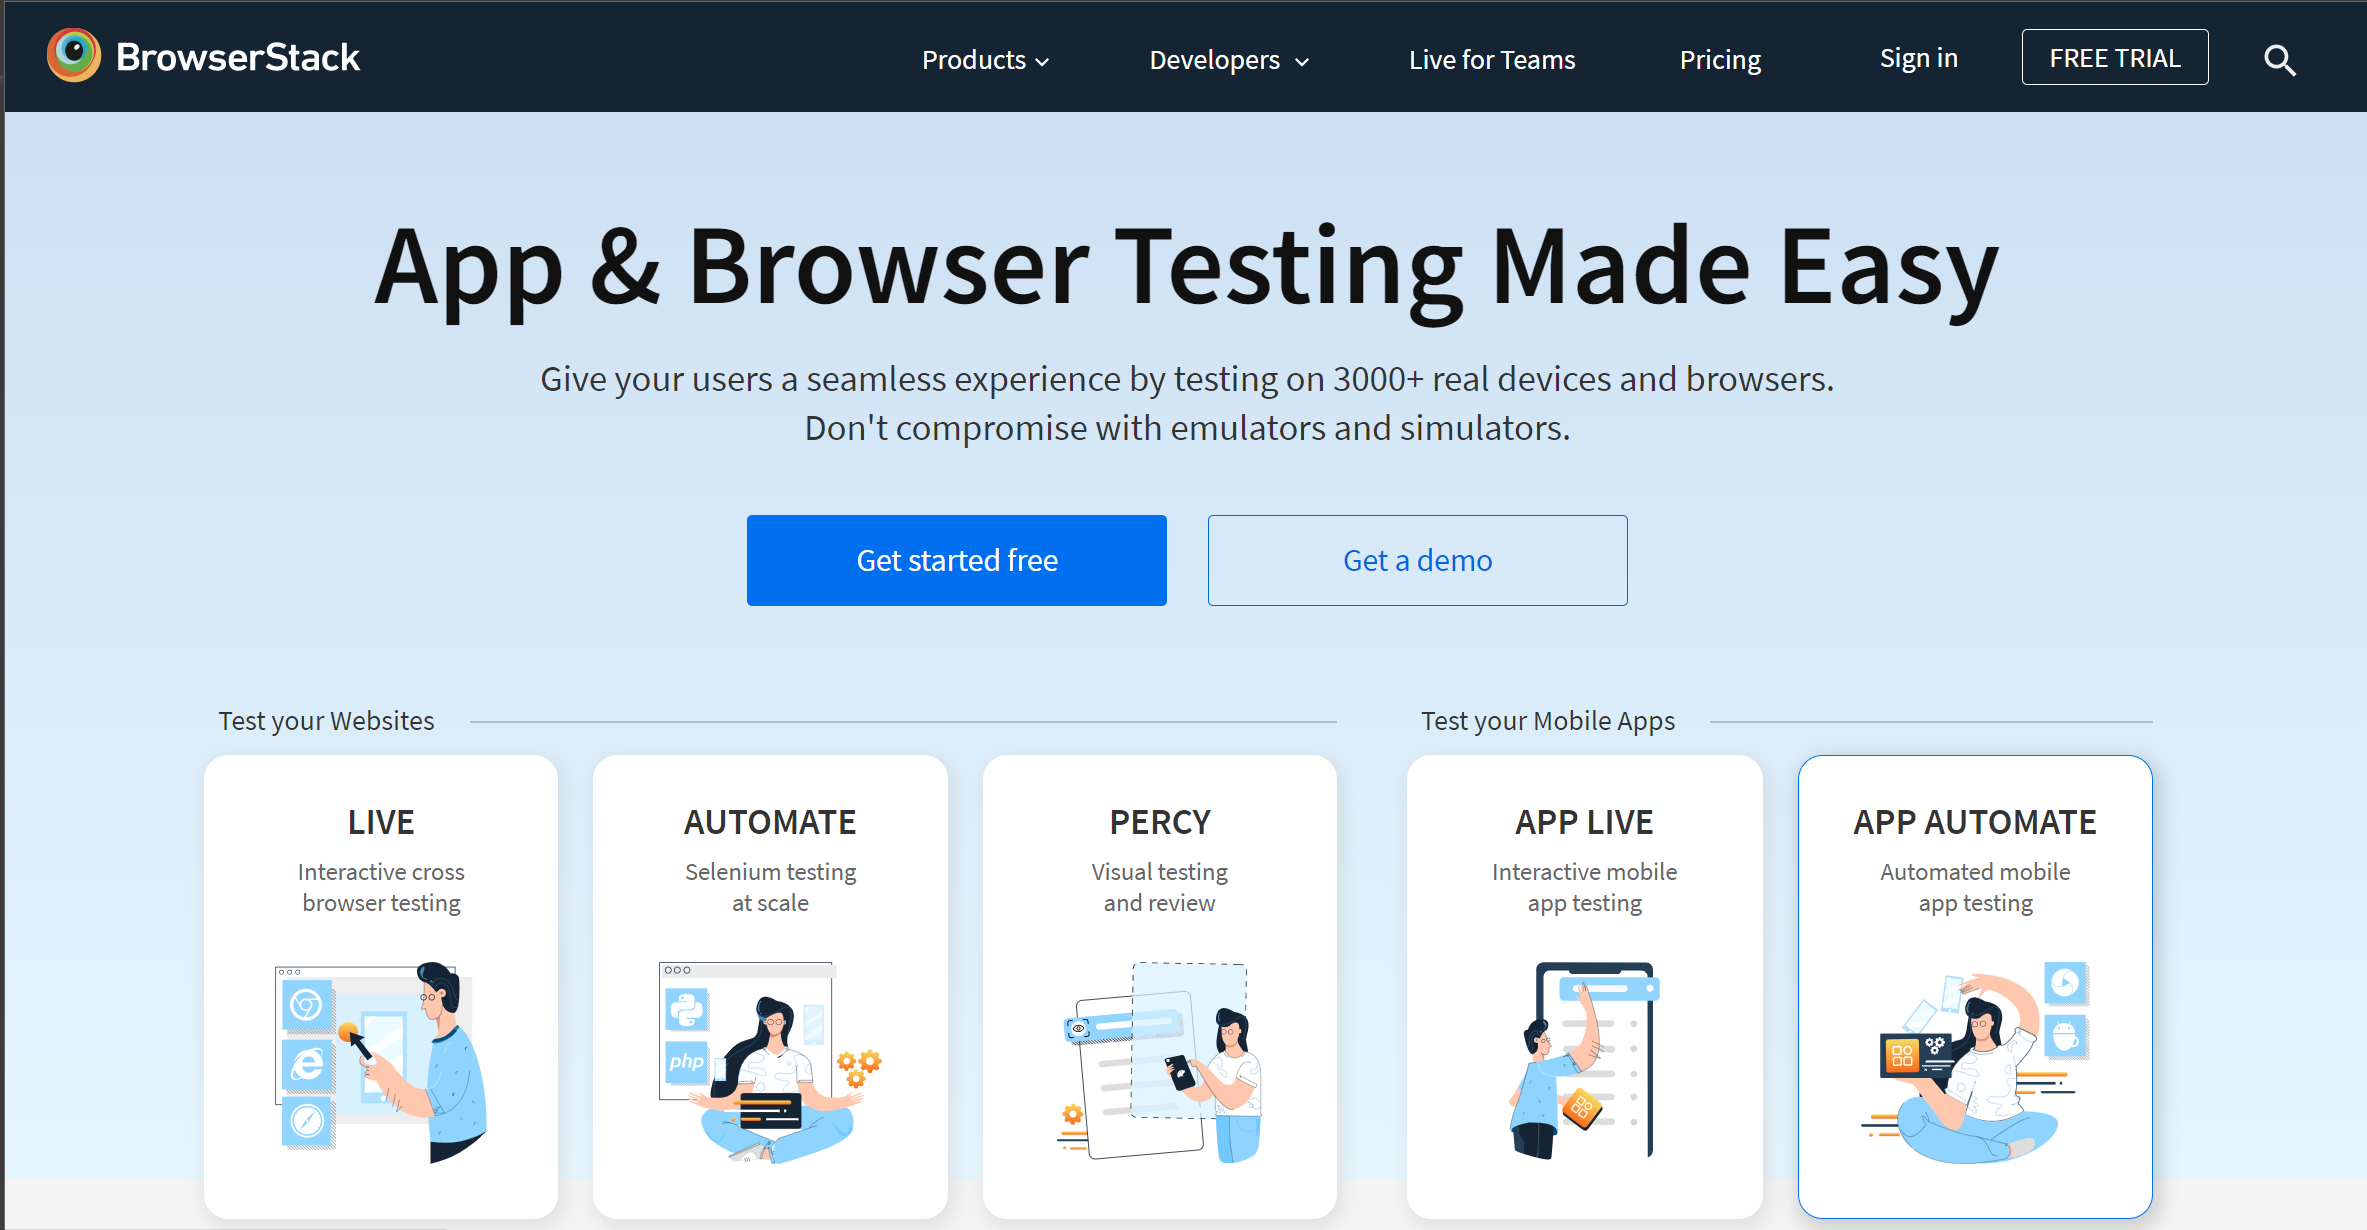
BrowserStack is another testing tool every front-end developer should know and use. This cloud-based cross-browser testing tool, i.e., lets developers test their web applications on a wide range of browsers and devices.
BrowserStack lets developers and testers access a virtual machine that runs different versions of browsers and Operating Systems(OS) without installing them locally. This makes testing easy on smartphones, tablets, and emulators and gives immediate feedback on how the application performs in different environments.
Here are the key Features of BrowserStack
-
Real-time testing: BrowserStack supports real-time testing to see how websites and web applications respond to user actions in a real-time environment, e.g., clicking links, filling out forms, and lots more.
-
Debugging tools: BrowserStack supports a range of debugging tools to aid developers in identifying issues and fixing them quickly and efficiently, e.g., the ability to inspect and edit HTML and CSS code in real-time.
-
Automated testing: Browserstack offers automated testing and debugging tools, as manual testing can be time-consuming and tedious. This saves time and reduces the chance of errors and bugs in your front-end codebase.
-
Cross-Browser testing: Browserstack can quickly test websites or web applications on various browser operating systems and devices. This helps ensure your web app or website functions correctly in different environments.
-
Better Collaboration tools: BrowserStacks supports multiple users to collaborate on testing and debugging tasks, improving communication and efficiency among teammates.
-
Excellent User Experience: Browserstack optimizes your website with a responsive design for different devices and browsers and tests it to prevent compatibility problems. Investing in compatibility will give users a better experience and reduce the chances of abandonment.
-
Integrations: Browserstack integrates with lots of development tools such as Jira, Jenkins, Selenium, Github actions, and lots more. You can read about them here.
Testing your website on multiple platforms can reduce the risk of unforeseen technical issues, safeguard against potential bugs, and help create a reliable and satisfactory user experience. Doing so can also ensure that the code functions correctly and that the website caters to many users.
Session Replay for Developers
Uncover frustrations, understand bugs and fix slowdowns like never before with OpenReplay — an open-source session replay tool for developers. Self-host it in minutes, and have complete control over your customer data. Check our GitHub repo and join the thousands of developers in our community.
6: WAVE Accessibility Tool
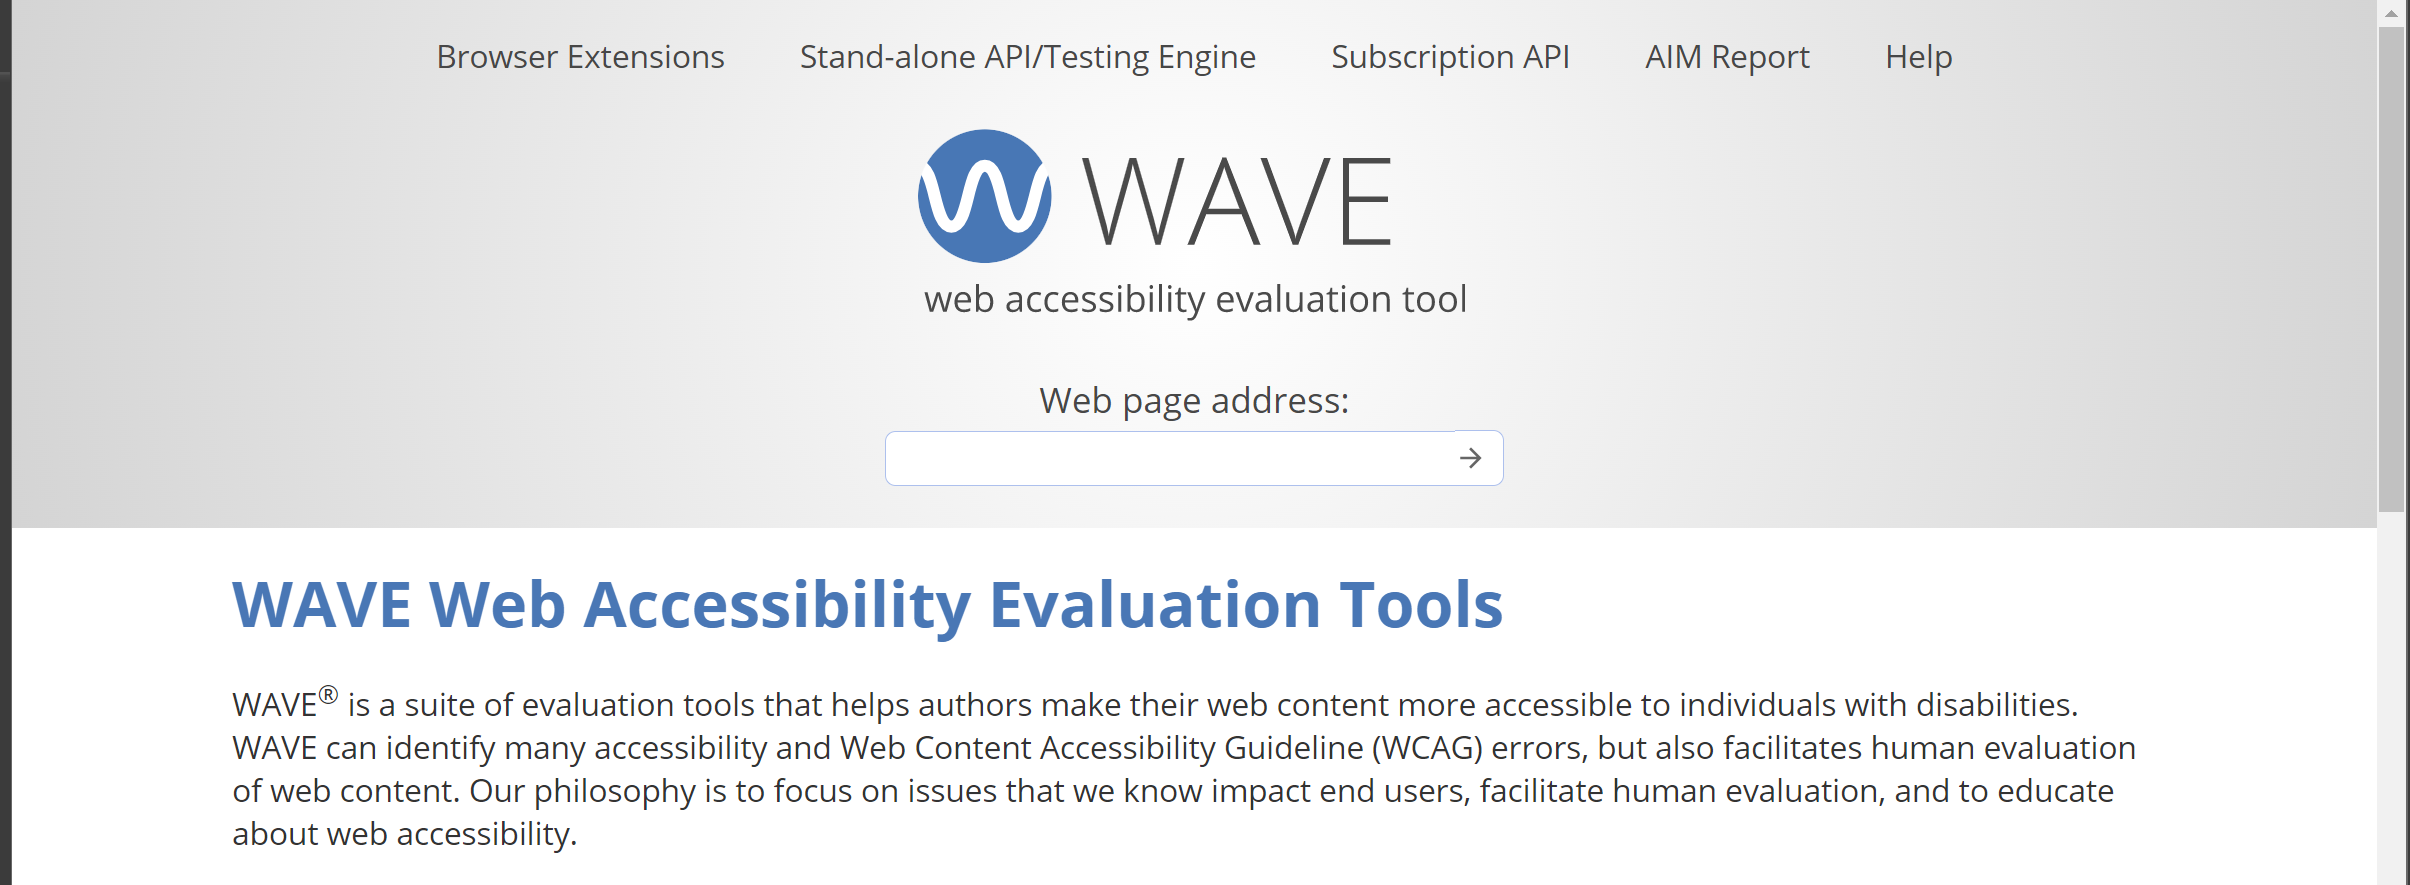
WAVE is a home of evaluation tools for website developers who make web content accessible to end users with disabilities. This tool identifies many accessibilities and Web Content Accessibility Guideline(WCAG) errors. It analyzes web pages and provides a detailed report highlighting accessibility issues such as missing alternative text for images, missing form labels, poor color contrast, and much more. These reports also have guidance on how to fix these issues identified.
Wave supports integrations with other tools such as Google Analytics, Siteimprove, and Hootsuite; these tools have ongoing monitoring and alert front-end developers when new accessibility issues are detected and help the web applications stay compliant with accessibility standards. In addition, Wave is available as a browser extension for Chrome and Firefox.
These are the main features of WAVE.
-
Detailed Reporting: WAVE generates detailed reports that highlight accessibility issues and provides guidance on how to fix the problems. The words are easy to understand and help front-end developers prioritize issues that need fixing.
-
Accessibility Testing: WAVE allows you to test your website for accessibility issues such as missing alternative text for images, missing form labels, or insufficient color contrast. It provides a detailed report of all problems found and suggested fixes.
-
Browser Integrations: WAVE is a browser extension for Chrome and Firefox, making it easy to use and access. Also, it supports integration with tools like Siteimprove, HootSuite, and Google Analytics.
-
Accessibility Widget: WAVE has an accessibility widget you can add to your website to help visitors with disabilities access the content easily. The widget can adjust the font size, contrast, and spacing, making it easy to read and navigate.
-
Compliance Monitoring: WAVE provides ongoing monitoring and alerts front-end developers when new accessibility issues pop up; this helps them comply with accessibility standards.
-
Multiple Language Support: WAVE supports various languages, making it easy for web developers to test their websites in different languages.
7: YSlow
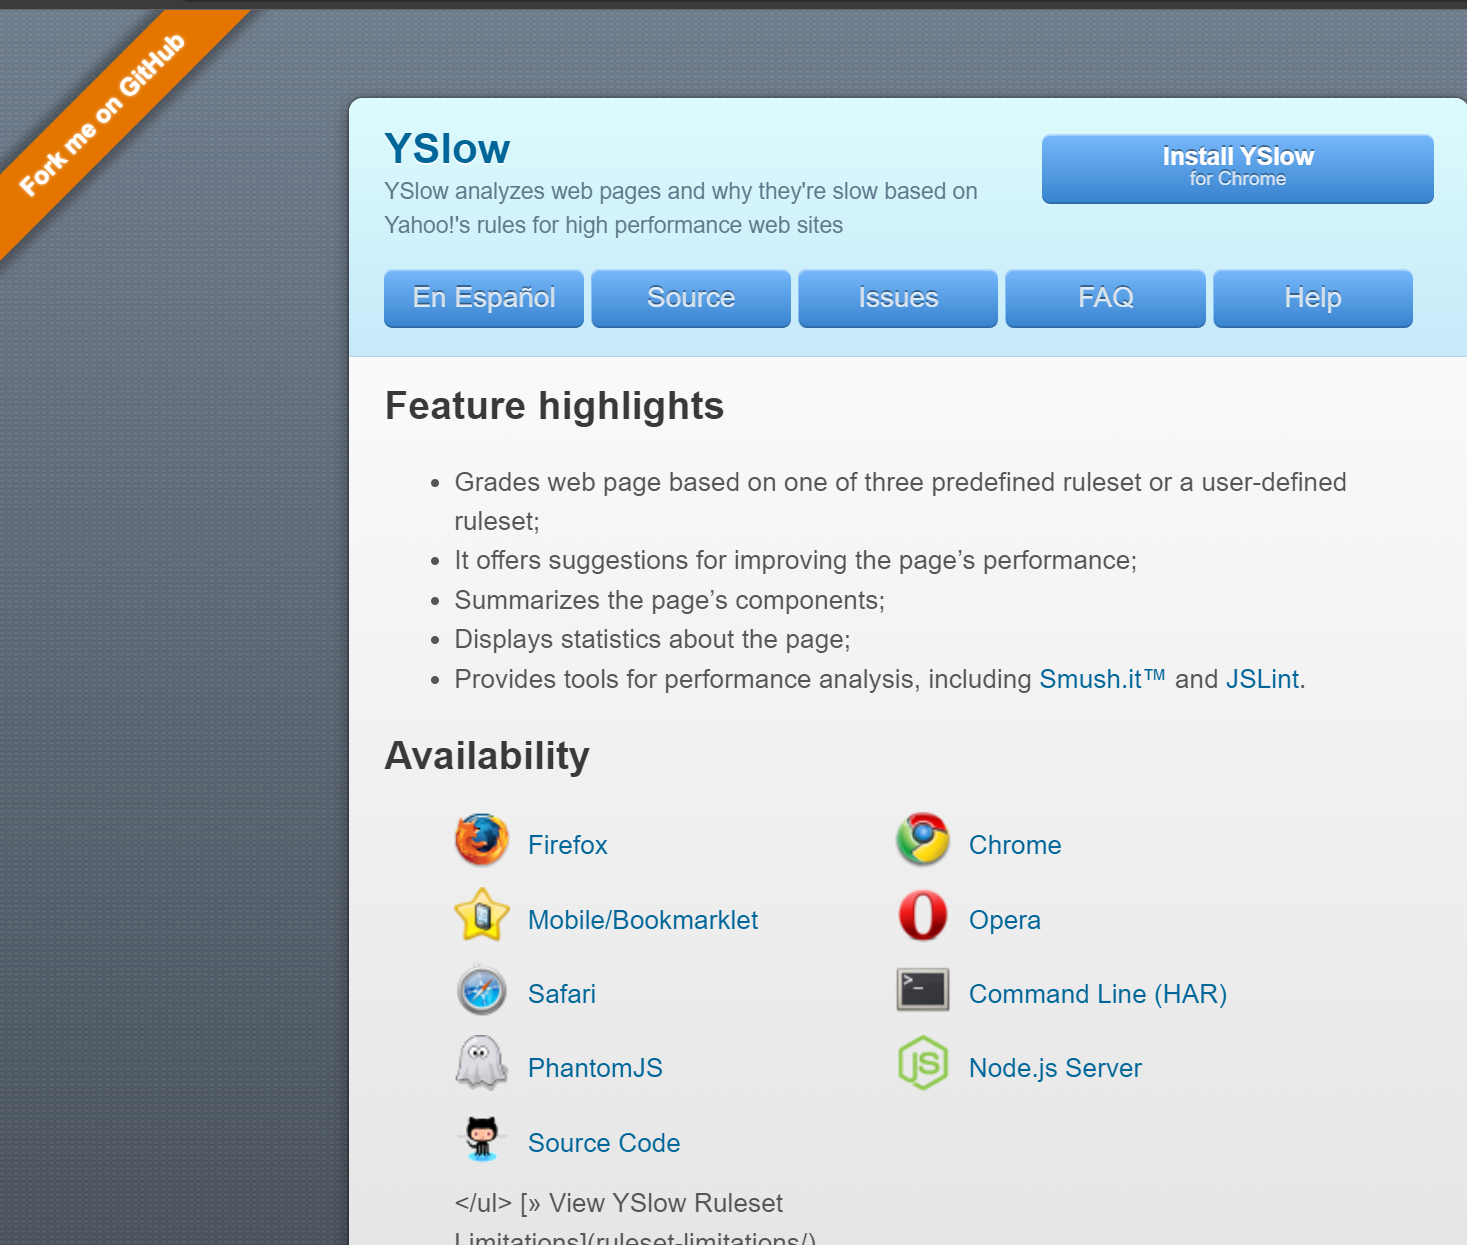
Yslow is an open-source web browser extension for analyzing web pages. It provides performance optimization suggestions on predefined rules for high-performance web pages. It evaluates web pages against 34 rulesets, including reducing HTTP requests, minimizing DNS lookups, optimizing images, using content delivery networks (CDNs), and more.
YSlow is based on the rules outlined in Yahoo as it was developed by them! Web developers and site owners commonly use it to optimize their websites for faster loading times.
Here are the key Features of Yslow:
-
Page analysis: YSlow analyzes web pages and provides a grade (A to F) based on predefined performance rulesets set. Also, it summarises the page’s components, including the total number of HTTP requests, full page size, and load time.
-
Performance recommendations: YSlow provides a list of performance optimization suggestions based on the rulesets, including recommendations for reducing the number of HTTP requests, compressing components, and optimizing images.
-
Detailed breakdown: YSlow provides a detailed analysis of each component on the website, including information such as the component’s size, load time, and HTTP status code.
-
Integration with other tools: YSlow integrates with other web development tools like Firebug, PageSpeed, and WebPagetest, allowing developers to access additional information about page performance and make further optimizations.
-
Accessibility analysis: YSlow includes an accessibility ruleset that checks for accessibility issues on the website and provides suggestions for improving accessibility.
-
Customization: YSlow supports front-end developers to customize the performance rulesets based on their websites’ needs and requirements.
You can try out the Chrome browser extension here and contribute to the tools source code here.
8: W3C Validation Tool
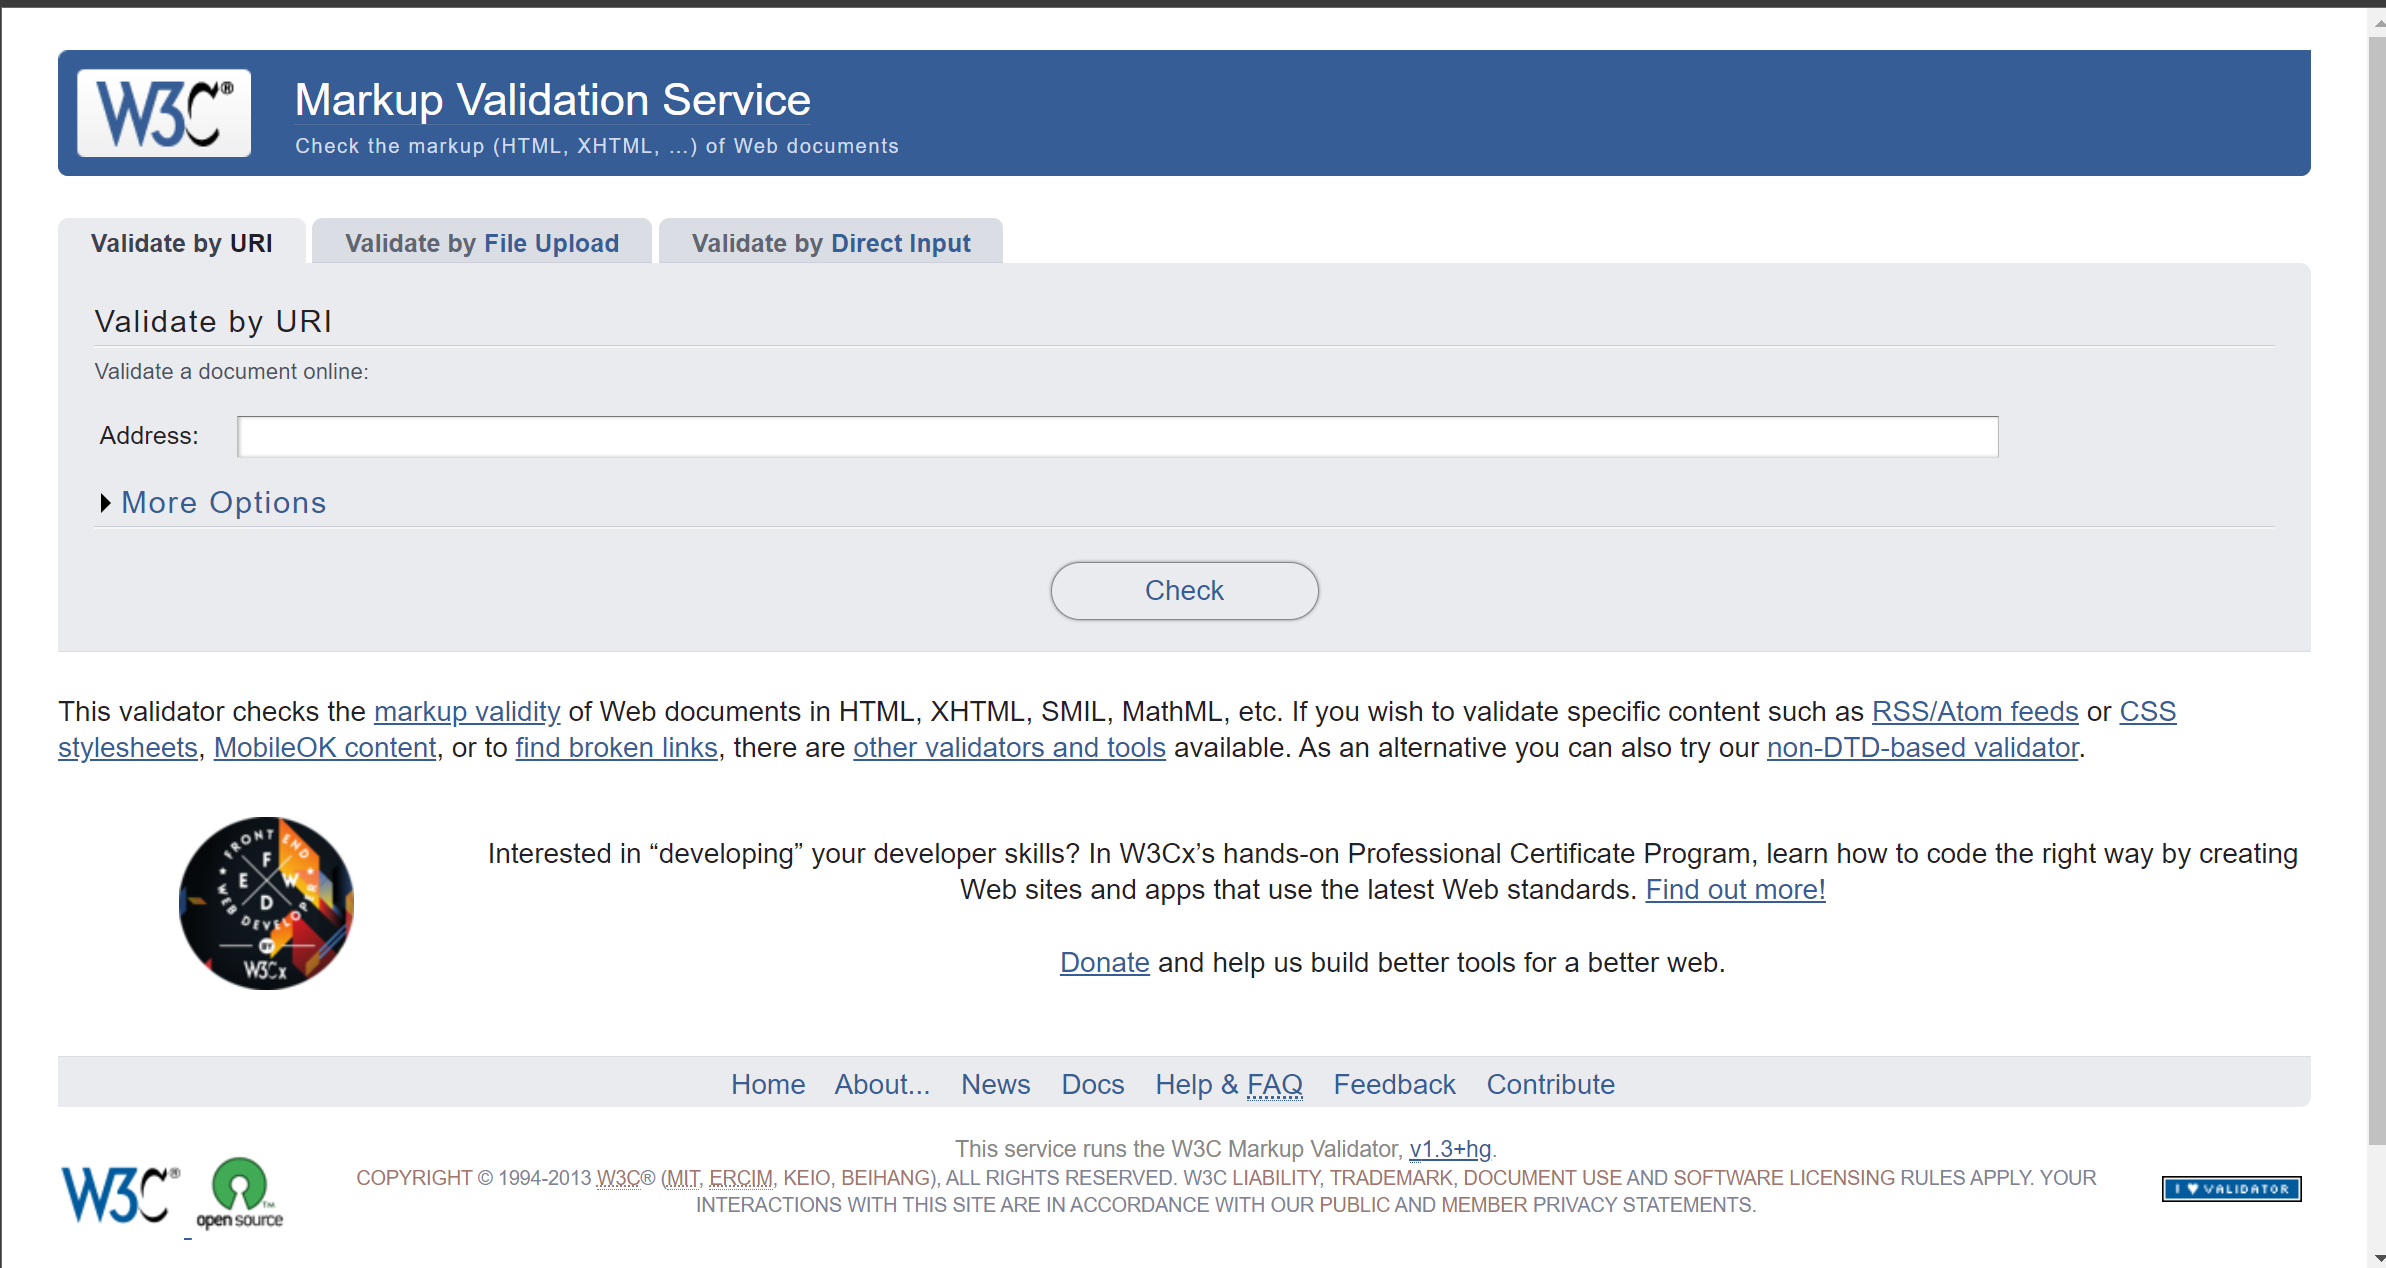
The W3C Validation Tool is a free online service that checks the markup and style sheets of web pages and web applications for compliance with the World Wide Web Consortium (W3C) standards. It analyzes HTML, XHTML, CSS, and other web document formats to ensure they follow the correct syntax and structure and conform to established web standards.
The W3C Validation Tool can help improve the quality, consistency, and accessibility of web pages and applications and ensure they are compatible with many web browsers and devices. It is handy for web developers, designers, and content creators who want to ensure their web pages meet industry standards and best practices.
Let’s see the features of the W3C Validation Tool:
-
Standards compliance: W3C Validation tool checks HTML, XHTML, CSS, and other web document formats to comply with W3C standards, ensuring that web pages and applications follow the correct syntax and structure.
-
Error identification: W3C Validation tool identifies errors, warnings, and best practices that may affect the functionality, accessibility, and interoperability of web pages ad web applications.
-
Detailed reports: W3C Validation tool provides a detailed description of any issues found, including line numbers and explanations of the errors or warnings, and offers suggestions for fixing them.
-
Accessibility checks: W3C Validation tool includes an accessibility checker that helps ensure web pages are accessible to users with disabilities.
-
Batch validation: W3C Validation tool allows front-end developers to validate multiple pages simultaneously, making ensuring consistency and standards compliance across large websites easier.
-
Third-Party Integration: W3C Validation tool can be integrated with other web development tools, such as content management systems or web editors, to streamline the validation process.
The W3C Validation tool helps to identify errors, warnings, and best practices that may affect the functionality, accessibility, and interoperability of web pages. It provides a detailed report of any issues found, including line numbers and explanations of the errors or warnings, and offers suggestions for how to fix them.
This tool can validate your website by inputting the URL or uploading a markup file.
9: HTML5 Outliner
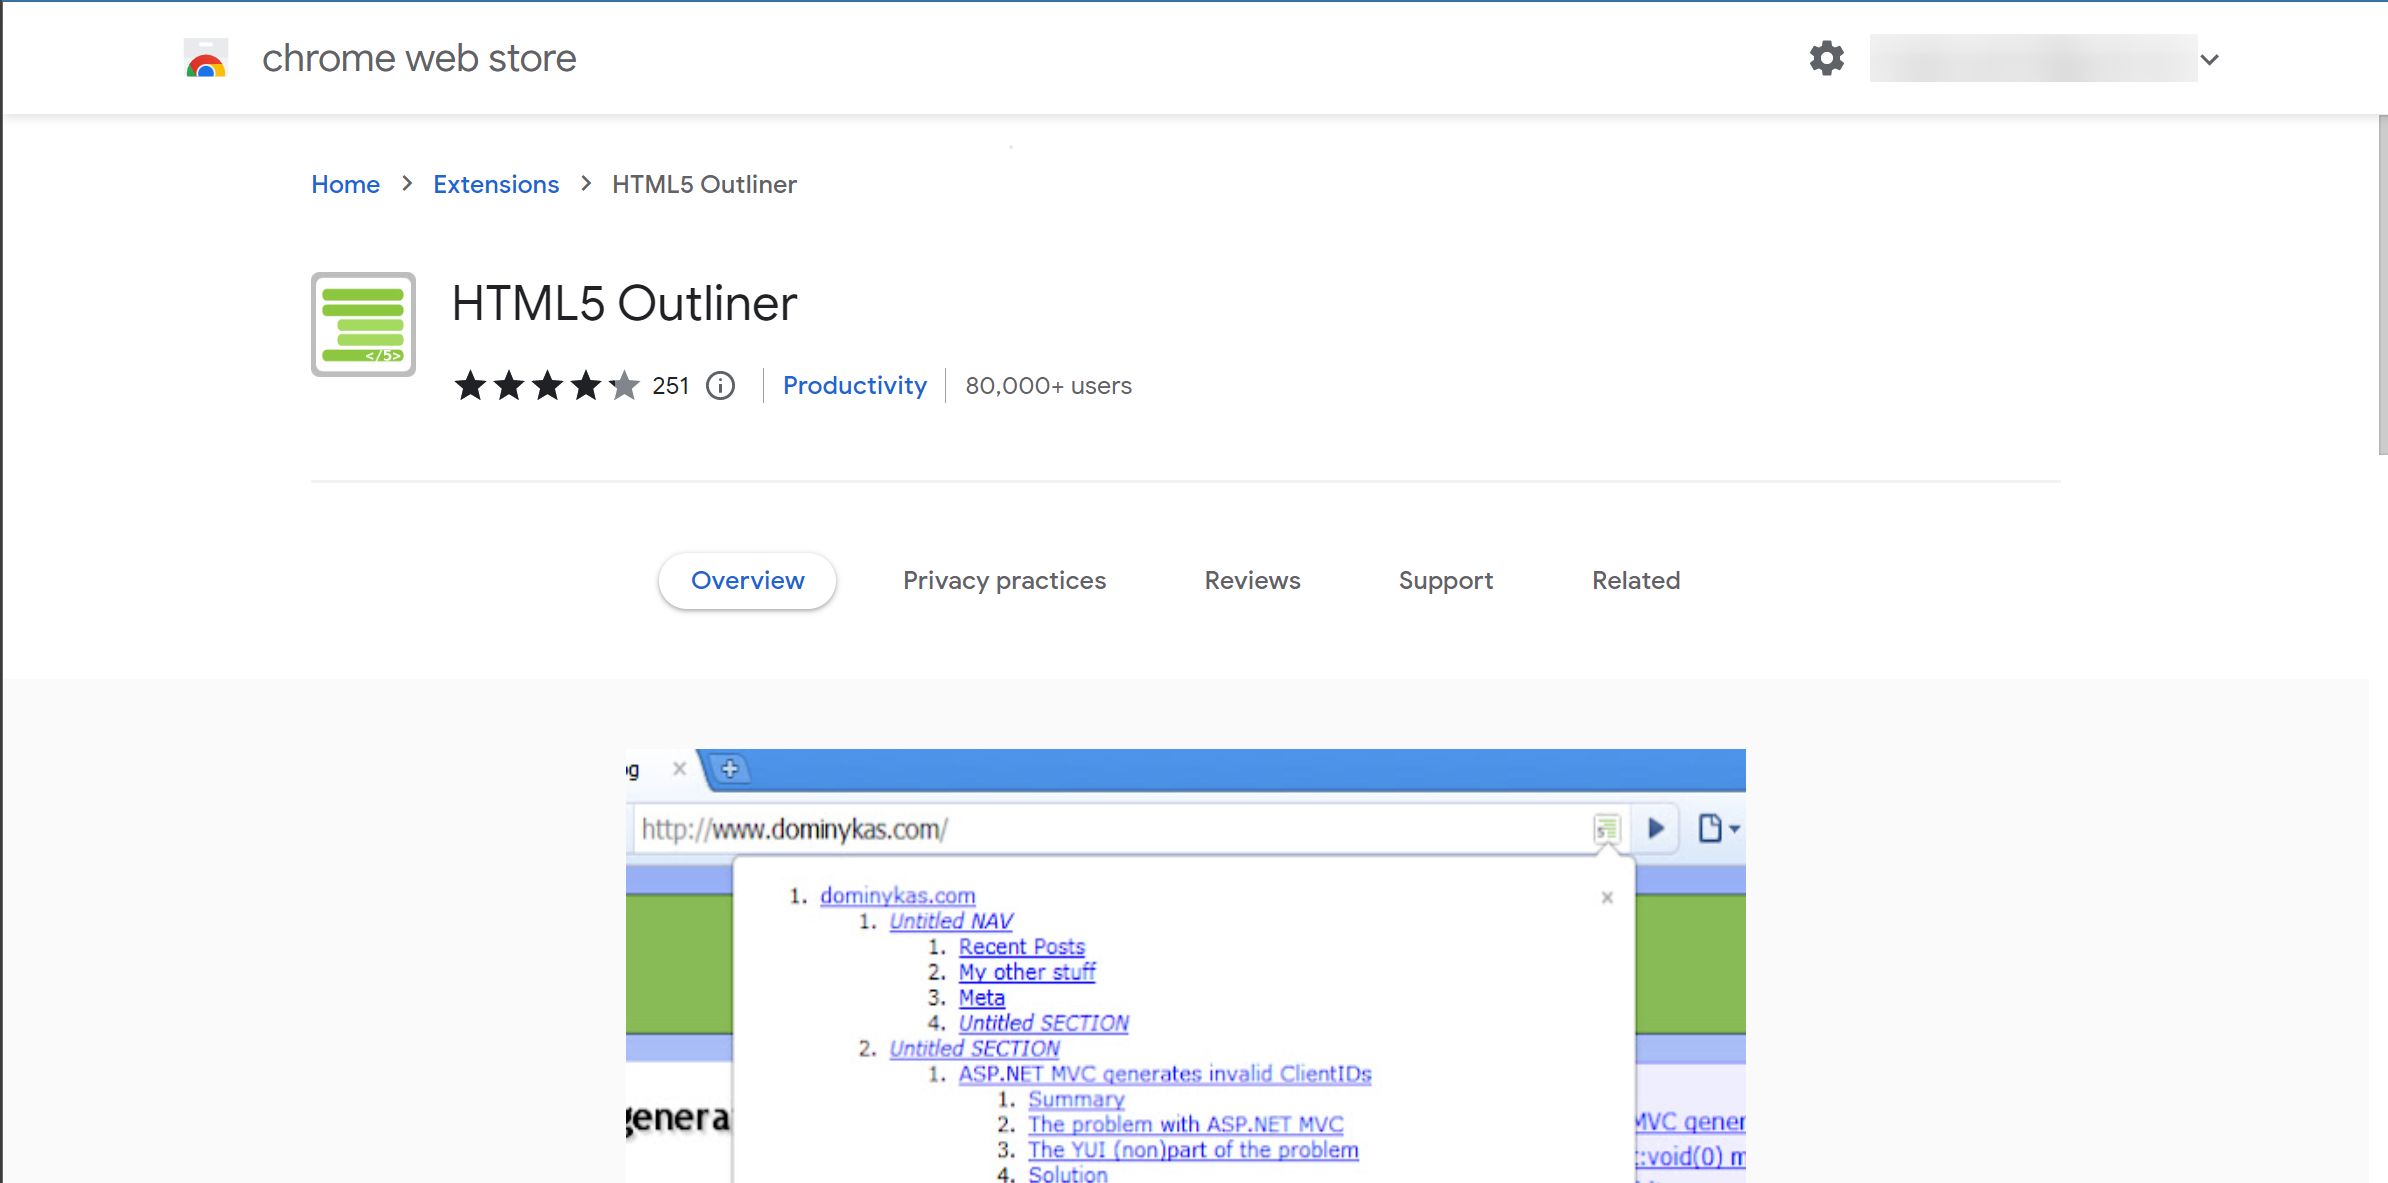
HTML5 Outliner is a Chrome extension web development tool that analyzes the structure of an HTML document and generates an outline of its content. This tool identifies the main sections of a web page and creates a hierarchical structure that shows how each section is related to the others. The outline generated by HTML5 Outliner is based on the HTML5 sectioning elements, such as:
article,header,nav,aside,section, andfooter.
These elements provide a semantic structure to web pages, making it easier for search engines, screen readers, and other tools to understand the content and its organization.
Here are the key features of HTML5 Outliner:
-
Structure analysis: HTML5 Outliner analyzes the structure of an HTML document and generates an outline of its content based on the HTML5 sectioning elements.
-
Hierarchical representation: HTML5 Outliner generated by HTML5 Outliner shows how each section of the web page is related to the others in a hierarchical structure.
-
Sectioning element detection: HTML5 Outliner detects missing or misplaced sectioning elements in the HTML document and provides suggestions for correcting them.
-
Accessibility checks: HTML5 Outliner helps to ensure that web pages are well-organized and accessible to users with disabilities by encouraging the use of semantic HTML and the proper use of sectioning elements.
-
Search engine optimization: HTML5 Outliner can help improve optimization by making it easier for search engines to understand and index the content by providing a clear and structured outline of the web page content.
-
User experience: HTML5 Outliner helps improve the user experience of a web page by ensuring that the content is well-organized, easy to navigate, and accessible to all users.
As a front-end developer, HTML5 Outliner is a valuable tool for web developers, designers, and content creators looking to ensure that their web pages are well-organized, accessible, and optimized for search engines.
10: CodePen
CodePen is an online social development environment for front-end web developers and designers. It provides a platform where developers can write, edit, and test code and share their work with others in the community.
Codepen is a web app with an editor that front-end developers can use to edit codes and a window for previewing HTML, CSS, and JS codes.
Here are the key features of Codepen:
-
Code editor: CodePen offers a code editor explicitly designed for front-end web development, supporting HTML, CSS, and JavaScript.
-
Live preview: Codepen’s code editor is accompanied by a live preview window, allowing developers to see how their code changes affect the web page’s appearance in real-time.
-
Collaboration: CodePen allows developers to collaborate with others in real time, making it easier to work on projects with multiple contributors.
-
Community: CodePen has a large and active community of developers and designers who share their work, provide feedback, and collaborate on projects.
-
Collections: Codepend supports developers in organizing their work into collections, making sharing and showcasing their projects more accessible.
-
Integration: CodePen integrates with other popular web development tools, such as GitHub, Slack, and WordPress.
As a front-end developer, CodePen is a valuable tool for front-end web developers and designers looking to improve their skills, collaborate, and share their work with the community. It provides a user-friendly and interactive environment for coding and testing web pages, making it an essential tool in the modern web development workflow.
Conclusion
In conclusion, modern web development is complete without using the browser DevTools. These tools are essential for front-end developers to inspect, debug, and optimize web pages. This article highlights ten must-have browsers DevTools for front-end developers, including Chrome DevTools, Firefox Developer Tools, Safari Web Inspector, and others. Each of these DevTools offers unique features and capabilities, allowing developers to streamline their workflow and enhance the performance and usability of their web applications. By using these DevTools effectively, front-end developers can save time, improve code quality, and deliver better user experiences.
Gain Debugging Superpowers
Unleash the power of session replay to reproduce bugs and track user frustrations. Get complete visibility into your frontend with OpenReplay, the most advanced open-source session replay tool for developers.