The Chrome Developer Tools extension for the open-source React JavaScript library is called React Developer Tools (also known as React DevTools). It is essential for debugging performance issues, viewing state, and analyzing Components. Installing the React Developer Tools browser extension is the simplest way to debug websites made with the React framework, and this article will show you where to go from there.
Using React DevTools is practically mandatory if you are using React. The following are its main features:
-
Components: The
Componentstab displays the root React components rendered on the page, along with the subcomponents rendered. -
Profiler: The
Profilertab enables you to record performance data. -
Source: The Sources tab allows you to set breakpoints and analyze Javascript expressions regardless of whether they were loaded from a separate file or were part of the page.
How to Install React DevTools Browser Extension
When starting React tooling, install the React Developer Tools browser extension first. This extension is popular among Chrome users. React Developer Tools is also available as an extension for Firefox; click here.
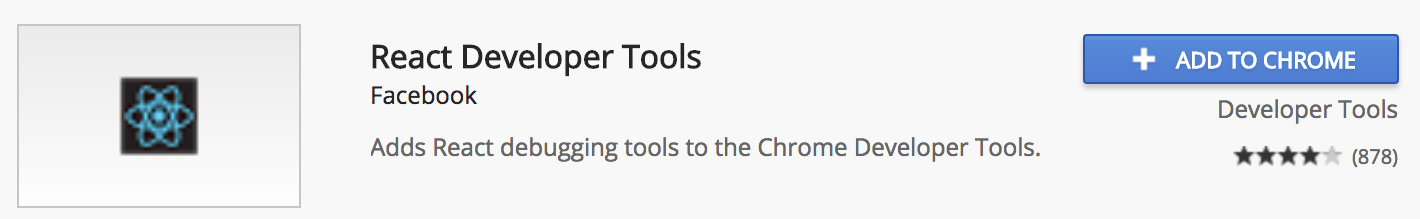
To install the extension in Chrome, click here. Then search for React developer tools:
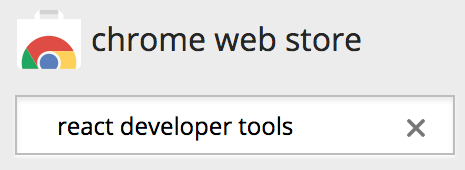
The first result should be the extension that you want. Click on the **ADD TO CHROME** button to install it:
Once you click on the **Add extension** button, the extension is marked as installed:
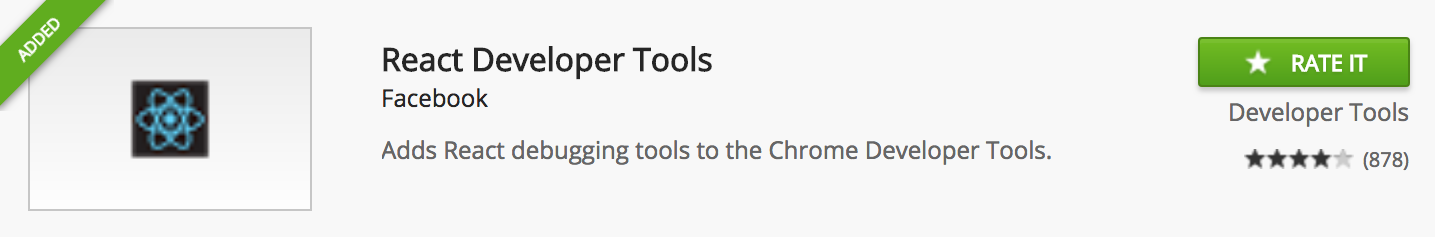
Your Chrome browser now has the React Developer Tools extension installed and enabled. You can inspect the page’s Components directly from the toolbar.
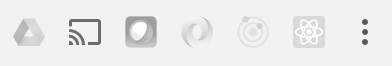
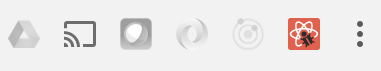
I have a few browser extension buttons here. The React Developer Tools button—the one with the React logo—can be found on the far right. When the button is greyed out, it indicates that you are not currently on a page that is running a React application. Try clicking on it while you’re on any random webpage:
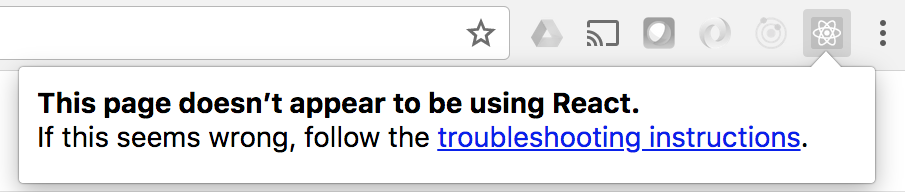
When you’re on a page running a React application, it will look like this.
Why is React DevTools Useful?
Below shows why React DevTools is useful to enhance your productivity as a developer:
- It allows you to validate
props, states, hooks, and other properties for eachComponent. - With React Developer Tools, you can inspect the React
Componenthierarchies. - They assist React and full-stack developers write faster and more efficient code.
- They make application debugging simple.
- They are simple to install on the browser, providing instant library and tool access.
- React
Componentstools allow for quick and easy examination of the root ReactComponents. - React developer tools allow you to investigate the effects of modifying one
Componenton the otherComponents. - The software testing process is simplified because the tools can identify problems quickly.
The following sections will show the major practical Use Cases of React DevTools.
Performance Testing with React Profiler
The React team introduced the React Profiler, an incredibly powerful feature for debugging performance-related issues, in September 2018. React DevTools includes a profiling feature that summarizes how your application renders. You’ll need to “record” a set of interactions, just like the regular JavaScript Profiler found in your favorite dev tools.
After that, you’ll see a visualization of each render your application performs, complete with accurate timing information and color-coded flame graphs. It even captures screenshots of every DOM update as of April, 2019.
Below is a blank react app. I have stripped the unnecessary files in the app. We have an input that has a value from a used state hook and an unchanged event listener, which will set the value of that name to the event.target.value, and a button that will create an alert which will say “Hey” and the name and the text on the button is “Click me” and a list Component which receives several items prop, now this list Component is just a for loop that will create a ul and inside of that ul will be put 200 or the number of items we pass li. The li is called a Component of list items that have the text.
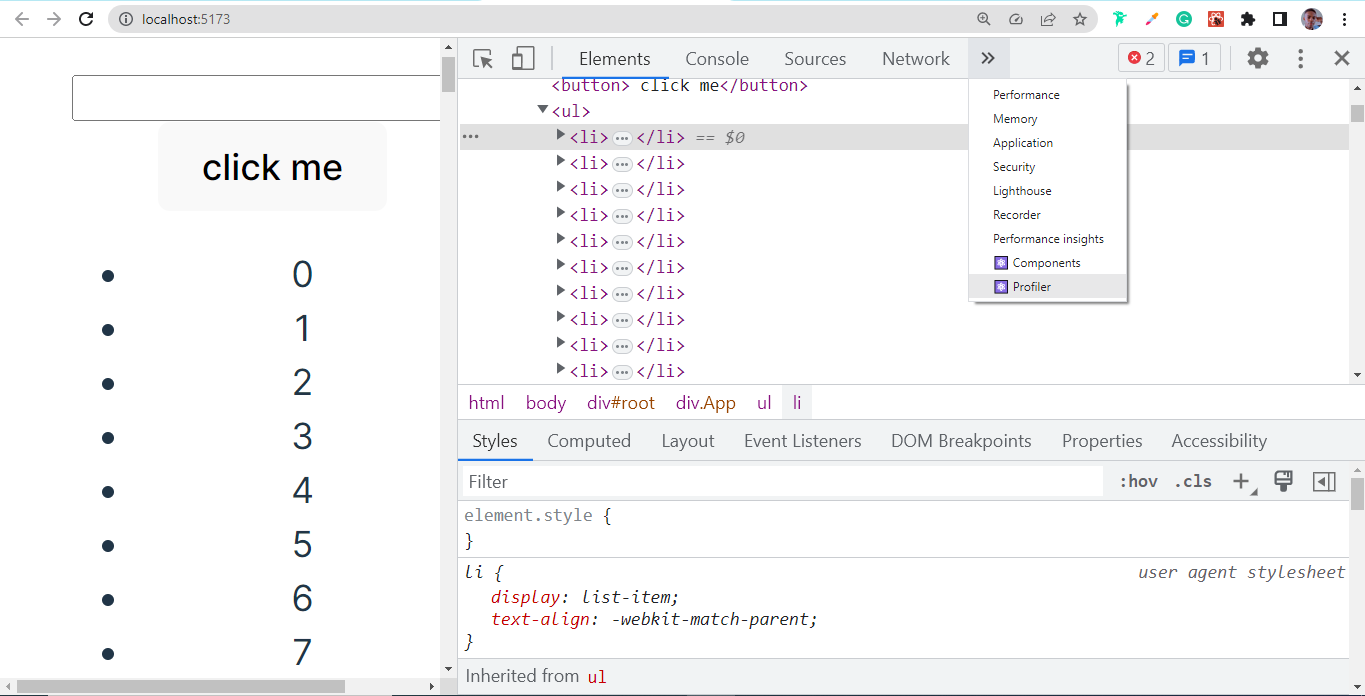
It’s nothing complicated; I used an example to show how the tool works. If we go to Google Chrome, we can access the Chrome dev tools. There you will see two new tabs at the top. If you can’t find them there, they are in the extended menu. One of the tabs is called Profiler, and the other is called Components.
import { useState } from "react";
import reactLogo from "./assets/react.svg";
import "./App.css";
function App() {
  const [name, setName] = useState("");
  const ListItem = ({ text }) => {
    return <li>{text}</li>;
  };
  const List = ({ numberOfItems }) => {
    const listItems = [];
    for (let i = 0; i < numberOfItems; i++)
      listItems.push(<ListItem text={i} />);
    return <ul> {listItems}</ul>;
  };
  return (
    <div className="App">
      <input
        onChange={(e) => {
          console.log(e.target.value);
          setName(e.target.value);
        }}
      />
      <button onClick={() => alert(`hey ${name}`)}> click me</button>
      <List numberOfItems={200} />
    </div>
  );
}
export default App;
How to Use the Profiler
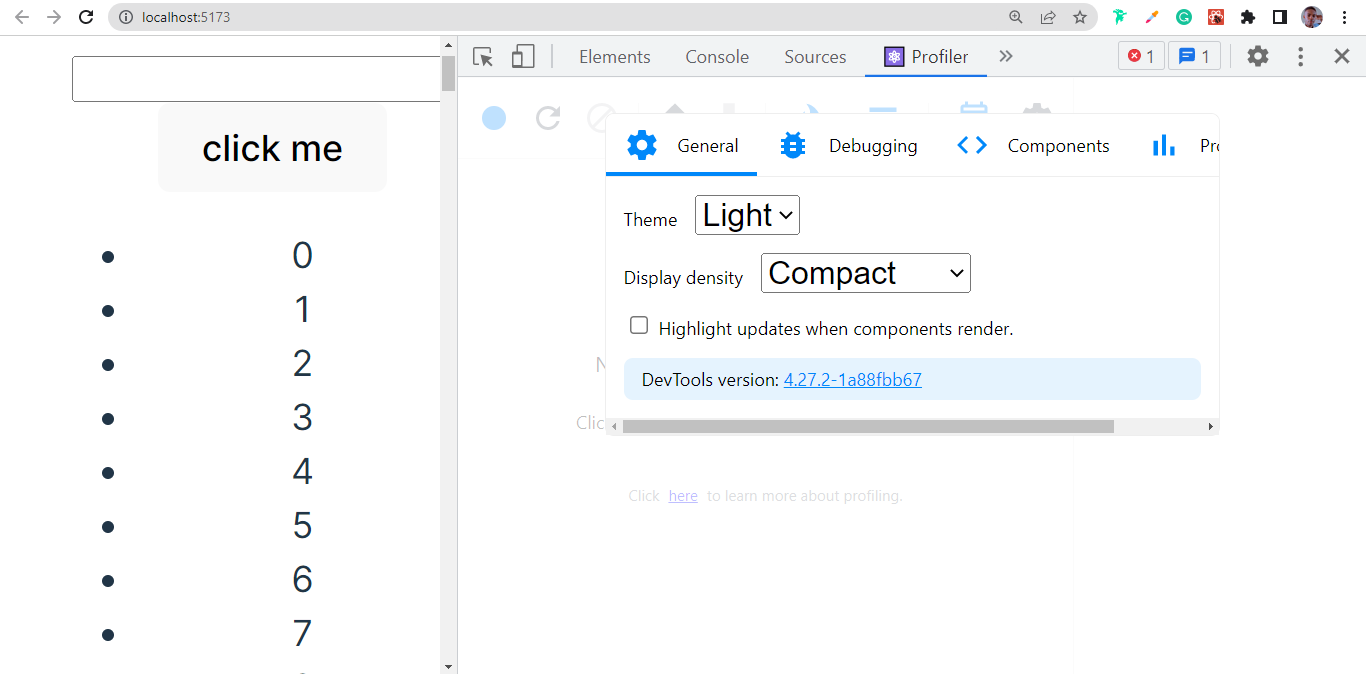
First, go to the Profiler tab, click on settings, go to the general tab, and select “highlight updates when Component render”.
Close the settings, then go back to the input tab and type something. You will see the highlight around each of the Components. This means that every time the component renders, it will put an outline around it. If it renders many times, the outline will change from green to yellow to red, depending on the number of times.
You can see we have a pretty big problem with our list because it rerenders every time we type something into the input; this is one way you can analyze your App. If you see some highlights when there shouldn’t be any Components that rerender, or maybe you expect just one part of the app to render, but for some reason your whole page lights up, then it means you have to analyze your App’s performance.
Deactivate it by unchecking “highlight updates when Component render” because it will only cause us visual problems.
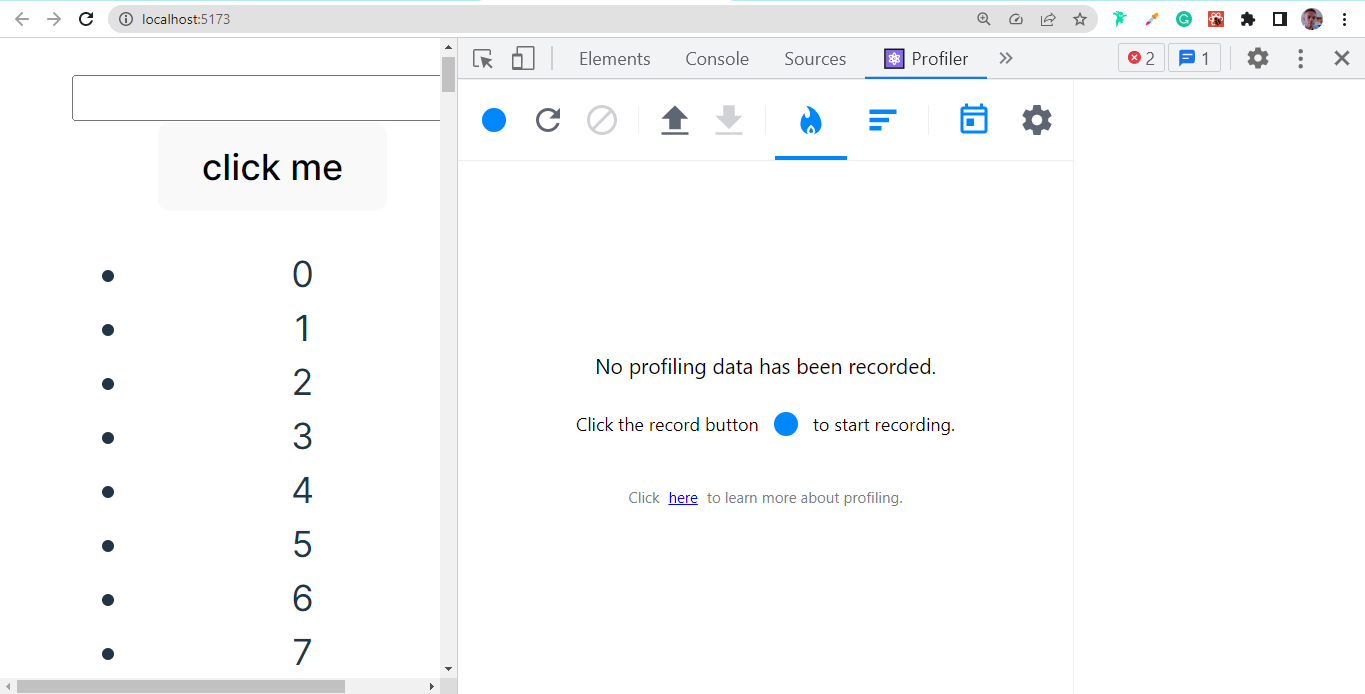
Let’s proceed to create the flame graph; there’s a blue button for recording at the top left corner of the image below.
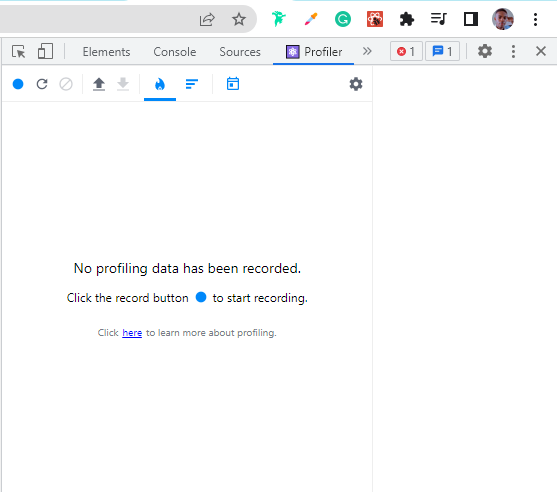
Once you click it, it will turn red, and now all the actions we perform will be recorded.
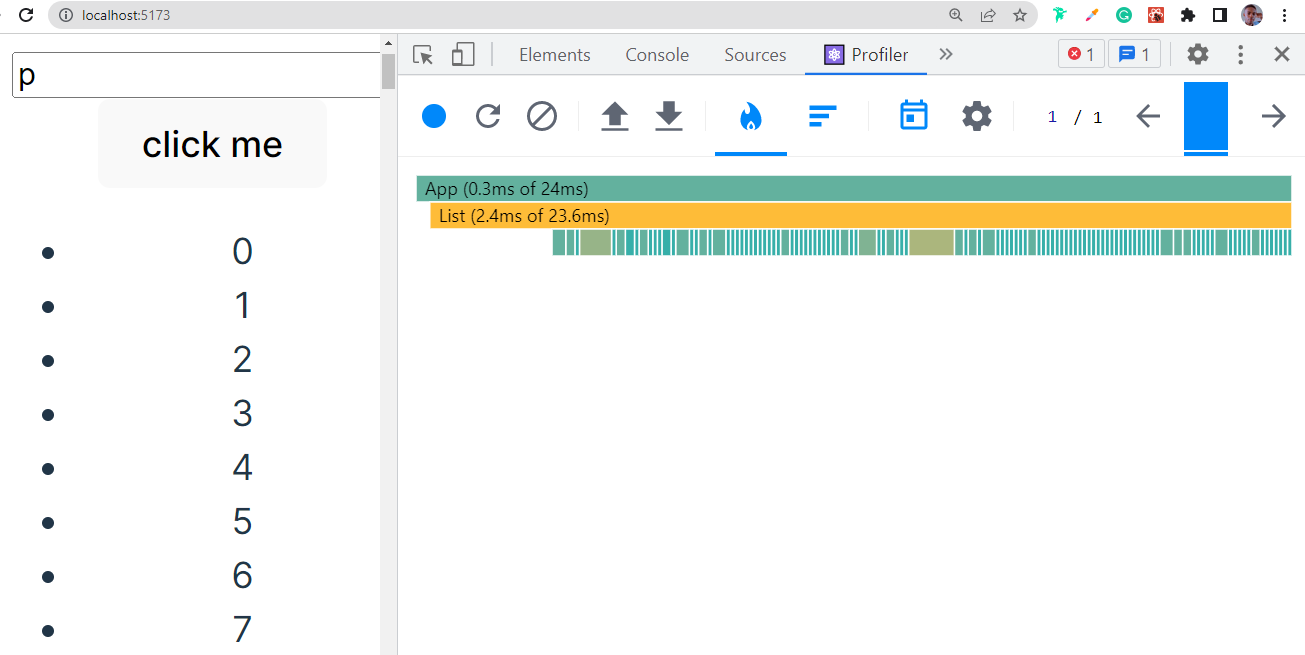
Type one letter inside the input tab and stop the recording by clicking the same record button. A flame graph will display right here, which shows us the Components. If the Components are highlighted with green and yellow colors, they are rendered. If they are grayed out, this specific action was not rendered.
Session Replay for Developers
Uncover frustrations, understand bugs and fix slowdowns like never before with OpenReplay — an open-source session replay tool for developers. Self-host it in minutes, and have complete control over your customer data. Check our GitHub repo and join the thousands of developers in our community.
Inspecting, Analyzing, and Debugging your Components with React DevTools
Even though you can locate and resolve most problems directly in React DevTools, sometimes debugging just works better with a trusted console.log. DevTools allows you to communicate with the Component instances through the console, which is one of my favorite features.
The console will appear when you select a component in React DevTools, and you can see both at once by pressing the Esc key. You can access the instance of that React Component from the console by typing $r.
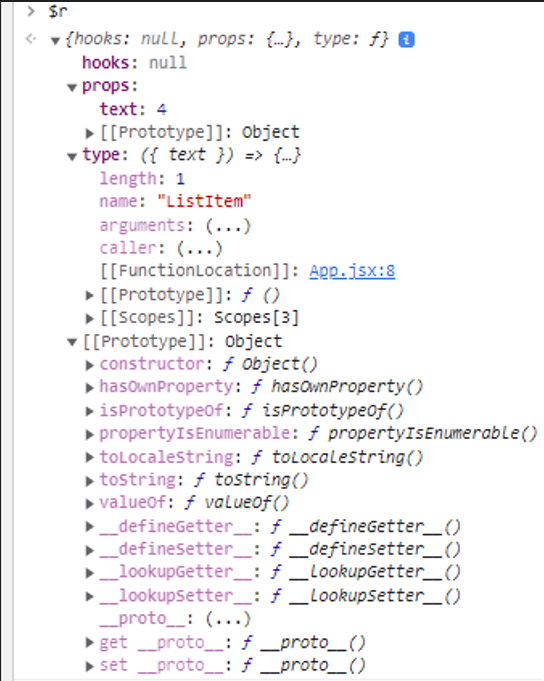
You have a ton of debugging power as a result. With DevTools, you can activate callback methods, access React state from the console, and even add functionality.
React DevTools also offers a nice little convenience feature if you’re interested in a specific function, like a click handler or callback function. A function in the props or state overview can be made available as a global variable by right-click. In this manner, you can call it whenever you want and in various contexts.
Interaction Tracing
Understanding why a specific commit or rerender took longer than anticipated in some circumstances can be challenging. React DevTools provides ‘interaction tracing’ as a result. This programmable API enables you to mark various app events and monitor their performance.
Install the scheduler package and import the unstable trace method. Which can be done with the following steps:
- Open your project directory in the terminal or command prompt.
- Install the React DevTools
schedulerpackage by running the following command:
npm install --save-dev scheduler- In your React component, import the unstable_trace method from the scheduler/tracing module:
import { unstable_trace as trace } from 'scheduler/tracing';- Wrap the code block that you want to track with the
trace method:
function handleClick() {
  trace('button-click', performance.now(), () => {
    // your code here
  });
}
The first argument of the trace method is a string that identifies the interaction. The second argument is the timestamp of when the interaction started. The third argument is a callback function that contains the code block that you want to track.
- Open the React DevTools in your browser and select the
Profiler tab. Click on the blue roundRecordbutton to start recording interactions.
- Interact with your application to trigger the code block you wrapped with the
trace method. - Stop the recording by clicking the Stop button in the React DevTools.
- Select the interaction you want to analyze and view the trace information in the
FlamegraphorRanked view.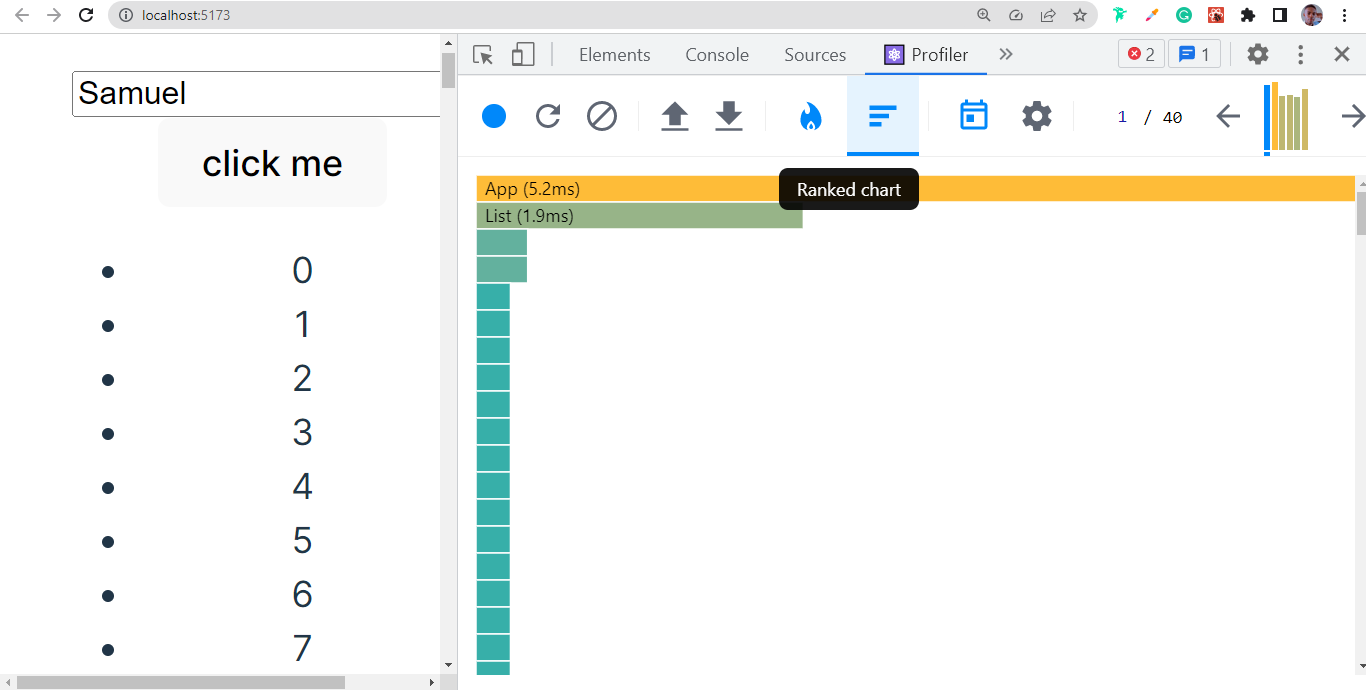
Note: The unstable_trace method is marked as unstable because it is not part of the official React API and may change in future releases. It is recommended to only use it for debugging and development purposes.
Viewing Source like a Pro
Modern browser debugging tools are far more powerful than most people realize. Breakpoints can be set, state and props can be inspected as your app changes, and code execution can be stepped through line by line. However, the code compiled with Babel is difficult to read and follow. Wouldn’t it be great to see the source exactly as you wrote it?
Babel includes a plugin that adds the __source property to all JSX elements. This allows React DevTools to navigate directly to the source code of the component you’re inspecting. It slightly slows down your application, but it works perfectly in development mode.
You can do so by following the steps outlined below:
- Install the Babel plugin babel-plugin-transform-react-jsx-source as a dev dependency in your React project:
npm install --save-dev @babel/plugin-transform-react-jsx-source- Add the plugin to your Babel configuration file (.babelrc or babel.config.js):
{
  "presets": [
    "@babel/preset-env",
    "@babel/preset-react"
  ],
  "plugins": [
    "@babel/plugin-transform-react-jsx-source"
  ]
}-
Start your React app and open it in the browser.
-
Select the component you want to view the source code of in the component tree.
-
Right-click on the selected component and select
"Show <component name> source"orToggle Sourcefrom the context menu.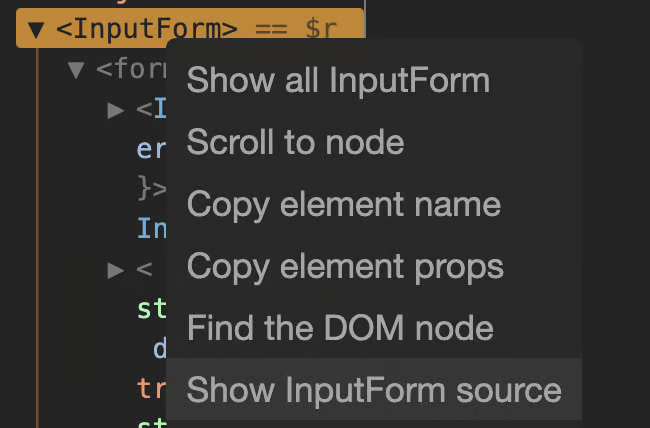
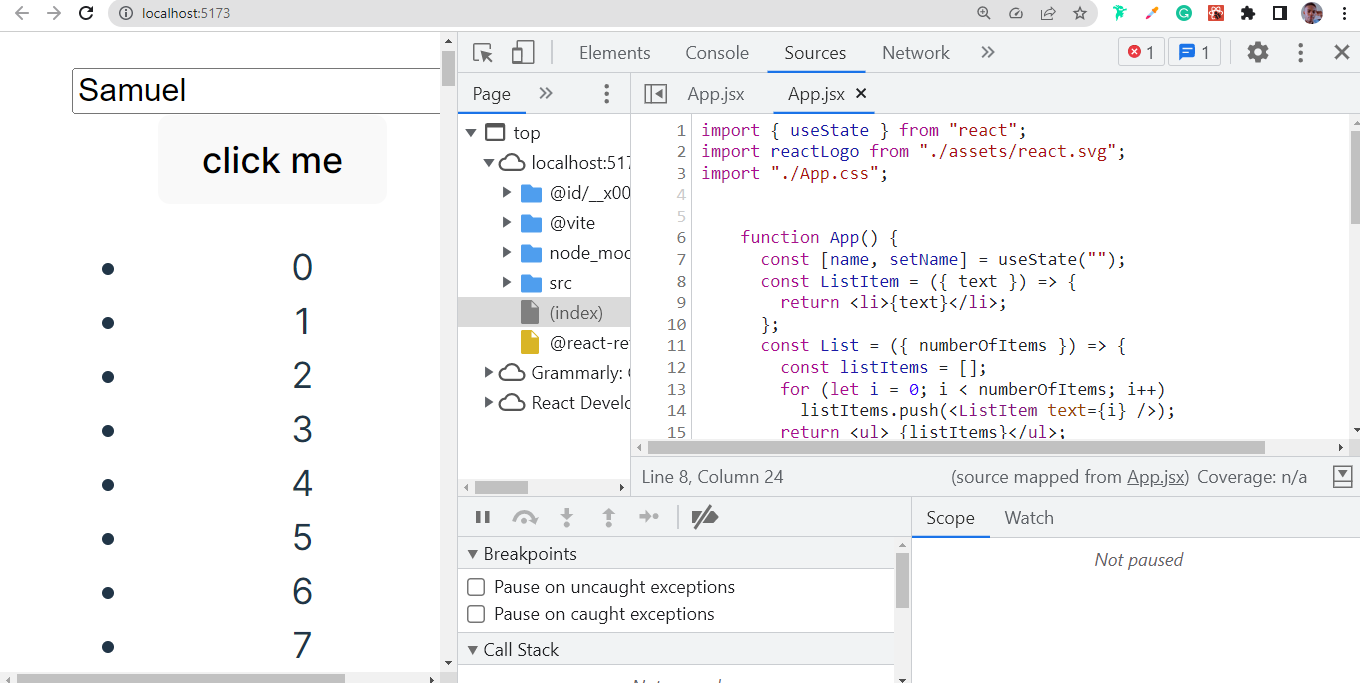
-
The component’s source code will now be displayed in the DevTools panel, with the original file name and line numbers.
Alternatively, viewing sources can also be done this way. After selecting the component, you want to view the source code in the component tree.
Click on this icon <> at the top right corner, as shown in the image below.
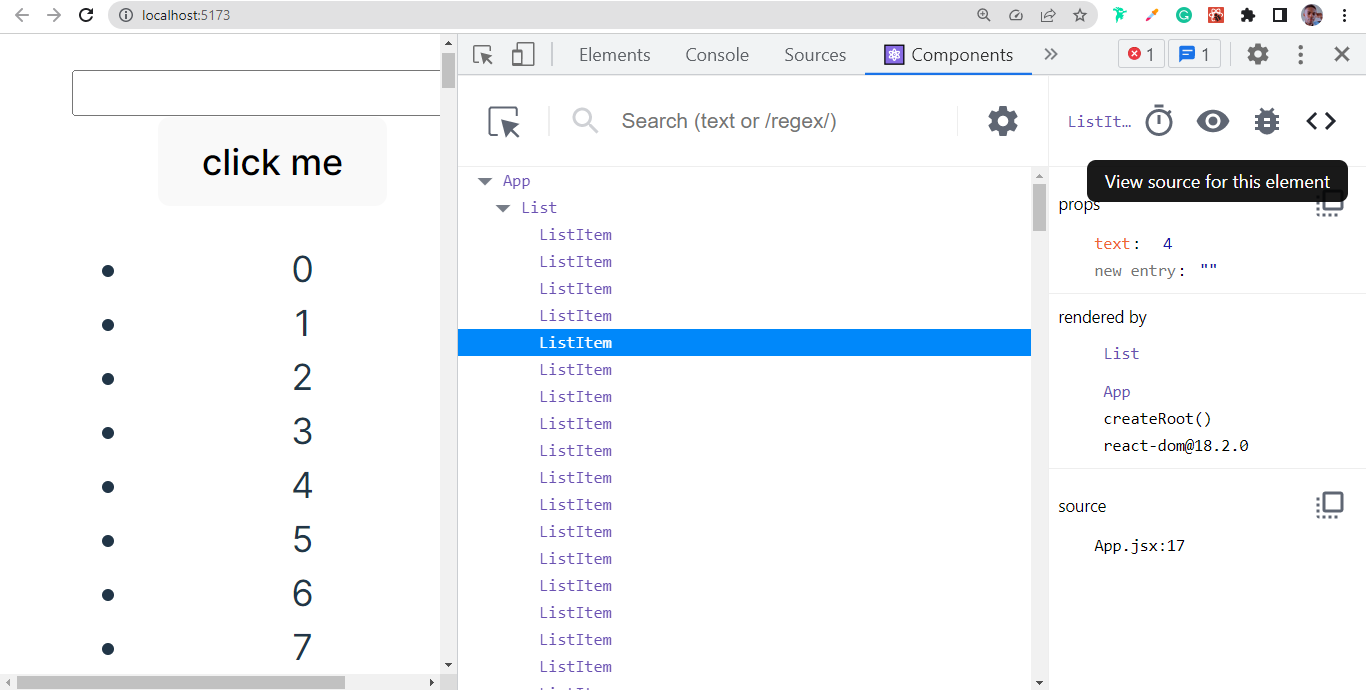
This will open the browser’s source view, where you can inspect, set breakpoints, and change the code entirely.

If you use the popular bootstrap tool Create React App, this will work right away. There is no configuration, no plugins, nothing. Simply go straight to the source!
Breakpoints can be set in the following ways below when on the viewed source code of the component in the DevTools panel.
-
In the editor, find the line of code where you want to set the breakpoint.
-
Click on the line number to add a breakpoint. A small blue shape will appear on the line to indicate a set breakpoint.
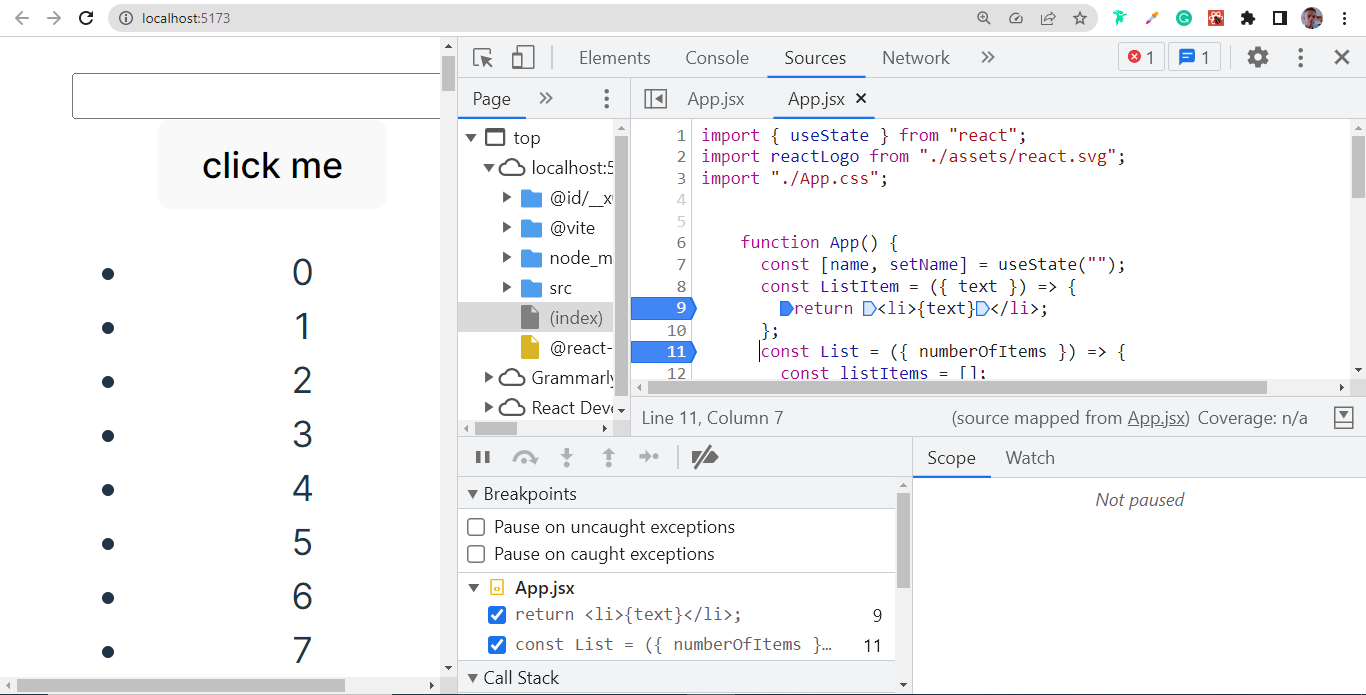
-
Now, you can trigger the code that should stop at the breakpoint. When the code execution reaches the breakpoint, it will pause, allowing you to inspect the variables and step through the code.
Note: You may need to refresh the page after setting the breakpoint for it to take effect. Also, make sure that your application is running in development mode for breakpoints to work properly.
Using React DevTools Themes to Change your Environment
Do you like to spend a lot of time making your development environment look just right? If so, you’ll be pleased to know that React DevTools is themeable. The following options for theming can be found in the General tab of the React DevTools settings:
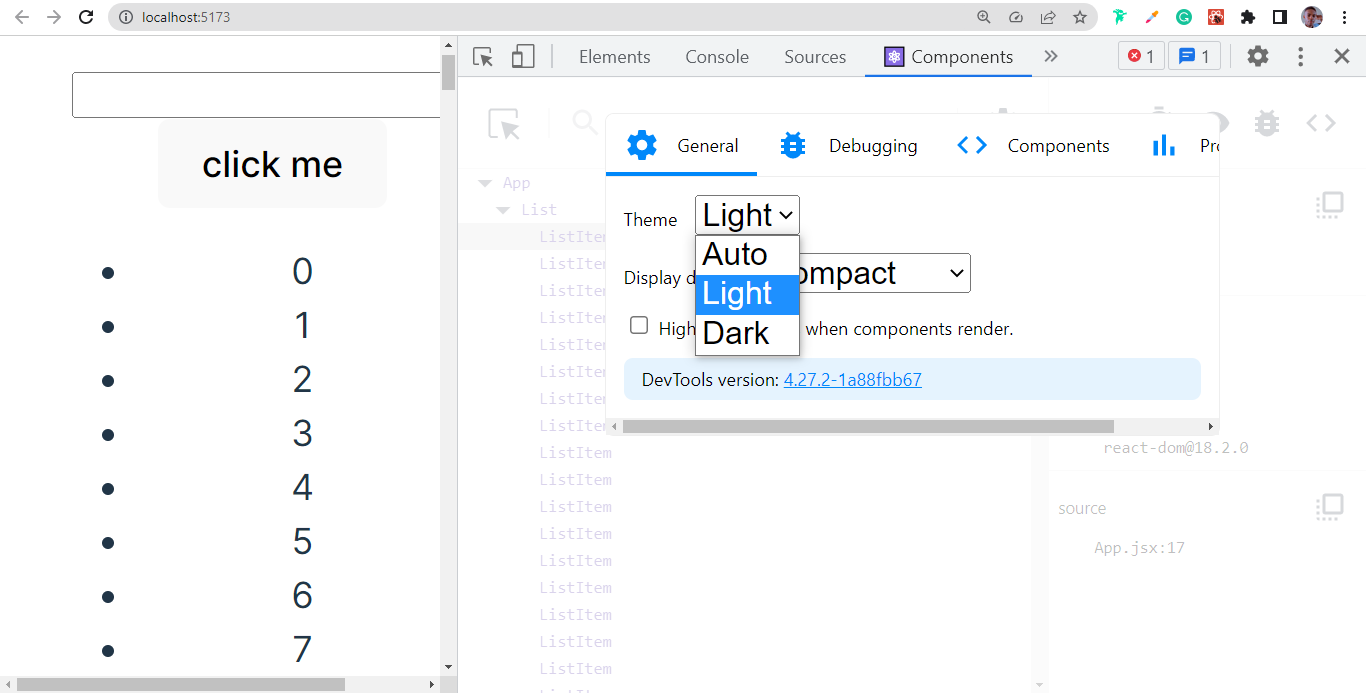
By default, it will use your browser’s theme. You can also toggle between light and dark themes at any time. To begin experimenting with themes, click the cog icon on the right side of the main panel, followed by the General settings tab.
Conclusion
React Developer Tools is essential for debugging performance issues, modifying Component props and states, and analyzing React Components.
It also simplifies React development, which makes it possible for quick and easy examination of root Components, and facilitates software testing.
Gain Debugging Superpowers
Unleash the power of session replay to reproduce bugs and track user frustrations. Get complete visibility into your frontend with OpenReplay, the most advanced open-source session replay tool for developers.