
Data Visualization and Business Intelligence with Dash


Dash is a framework used for creating Python web apps. It is primarily used for creating interactive visualizations and is built on top of React and plotly.js for the front end and Flask. While desirable, one does not require much knowledge of HTML5 (HTML, CSS, and JavaScript). All the functionality necessary to make the web app is handled in Python. For those who wish, you can create custom components using React for the front end and integrate any modules you require for the back end.
Plotly is a standalone open-source library that provides highly customizable charts. Using non-opinionated open-source technologies like React and Flask makes it extremely easy to extend as per the system’s requirements. Combined with Python being sufficient to create web apps, it is a highly productive framework for data visualization and BI apps.
Installing Dash
To install Dash, run the command:
pip install dashEnsure it was installed correctly using the following code in Python prompt:
import dash

dash.__version__
This should output the version of Dash you have installed if all went well. For this tutorial, the version being used is 2.6.1.
Creating your first Dash app
To create your first Dash app, type the code below. We shall look into it shortly.
  #dasher.py
  #import required libraries
  import dash
  from dash import html

  app = dash.Dash() #create the dash web app
  app.layout = html.Div(children = [ #root div element with 3 chilren elements
  html.H3(children='Welcome to Dash'),#h3 header element with child text element
  html.P(children=['The dash adventure begins...']), #p paragraph element 1
  html.P(children=['Buckle up!!!']) #p paragraph element 2
  ])
  #start the web app server
  app.run_server(debug=True)
Run the file using Python dasher.py or the name of your script. This launches your first Dash web app on your machine, which by default is on port 8050. The output is shown below:
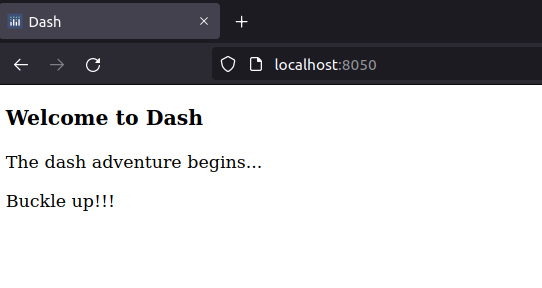
The code above imports the Dash module and then imports HTML components corresponding to HTML elements and attributes. We then create an app using the Dash constructor. Finally, we define the app’s layout by setting it to various Dash HTML components.
We start the server by calling the run_server method on the declared Dash app. By setting debug to True when running the server, we get features useful for development and debugging, including hot reloading and detailed error/warning messages. The code can be declaratively written using HTML as shown (ignoring React-specific details like unique ids for elements):
  <div>
      <h3>Welcome to Dash</h3>
      <p>The dash adventure begins...</p>
      <p>Buckle up</p>
  </div>
With those few lines of code, we have created our first, albeit not very exciting, Dash web app. Let us look briefly at the different parts of Dash before creating a flashier web app in less than 20 lines of code!!!
Session Replay for Developers
Uncover frustrations, understand bugs and fix slowdowns like never before with OpenReplay — an open-source session replay tool for developers. Self-host it in minutes, and have complete control over your customer data. Check our GitHub repo and join the thousands of developers in our community.
Dash layouts
Dash is based on simple concepts, layouts, callbacks, and state. Layouts are concerned with the structural and presentational details of the web app, that is, the DOM. Callbacks handle interactivity from user interaction, client-side events, and server-side events. Dash state handles data and state management in apps. In this tutorial, we shall be looking at Dash layout.
Dash layouts are used for providing the web UI and visualizing data. The layout comprises Dash layout components, both from Dash and user-defined ones. There are two main types of Dash layout components, Dash HTML components and Dash core components. These are then used as one way of creating user-defined reusable custom components.
Dash HTML components
As stated before, the Dash HTML components correspond to HTML tags and attributes, plus React components provided by Dash. All the attributes you expect from HTML tags are available in Dash HTML components. These components are contained in the module dash.html, by convention imported as HTML, i.e., from dash import html
Below is code to showcase the use of HTML components:
  #dasher2.py
  #import required libraries

  import dash
  from dash import html

  #create and run the dash web app
  app = dash.Dash()
  app.layout = html.Div(style={'textAlign':'center'}, children=[ #div root element dash html component
  html.H3('Welcome to Dash Mastery!!!'), #h3 heading element dash html component
  html.P('Welcome to our dash mastery whirlwind tour. There is no library like dash for increased productivity.'),
  #p paragraph element dash html component
  html.Label('Loading more...'), #label element dash html component
  html.Br(), #br break element dash html component
  html.Progress(value='20', max='100') #progress bar dash html component
  ])

  app.run_server(debug=True) #run the web app
The output is shown below:
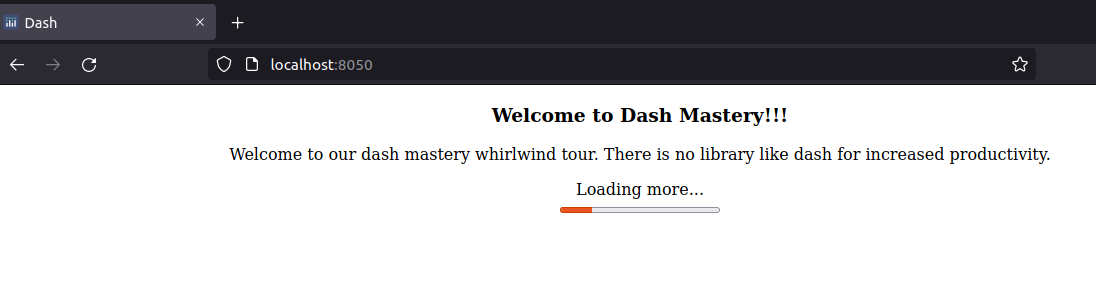
In the code above, we import the required Dash libraries. We then create a Dash web app object. We initialize the Dash app’s layout with a Dash Div HTML component that will be the root element of our app.
Inside the div, we create four Dash HTML components, the heading, paragraph, break, and progress bar element. Notice the direct mapping between Dash HTML components and HTML tags and attributes. This line of code, html.Div(style={'textAlign':'center'}, children=[...]), is equivalent to the markup below in HTML <div style=" text-align:center;">...</div>.
Finally, we run our server in debug mode by calling the Dash web app object’s run_server method.
Dash core components
The Dash core components provide a high-level API for handling common presentations in a data viz or BI web app like graphs, charts, markdown text, dropdowns, etc. These components provide a lot of the functionality typically required in web-based data viz apps. These high-level components include user input (Dropdown, Slider, etc.), visualization (Graph), and documentation (Markdown) components.
The code below showcases some of Dash’s core components. The Graph core component shall be touched upon briefly and in depth later.
#dasher3.py
#import the required libraries
import dash
from dash import html, dcc

#create the dash web app
app = dash.Dash()
app.layout = html.Div(children=[ #div root element
 html.Div(children=[ #div container element
  html.Label('Name'), #label element component
  dcc.Input(type='text') #input element dash core component
  ]),
 html.Div(children=[ #div container element
  html.Label('Gender'),
  dcc.RadioItems(options=[ #radio group element dash core component
   {'label':'Male', 'value':'male'},
   {'label':'Female', 'value':'female'}
   ], value='male')
  ]),
 html.Div(children=[ #div container element
  html.Label('Hobbies'),
  dcc.Checklist(options=[ #checkbox element dash core component
   {'label':'Movies', 'value':'movies'},
   {'label':'Music', 'value':'music'},
   {'label':'Sports', 'value':'sports'},
   {'label':'Hiking', 'value':'hiking'},
   ])
  ]),
 dcc.Graph(id='viz1', figure={ #graph element (dash core component)
  'data': [{'x': ['Yes', 'No'], 'y': [40,20], 'type': 'bar'}]
  })
])

app.run_server(debug=True) #start the web app
The output is as shown below:
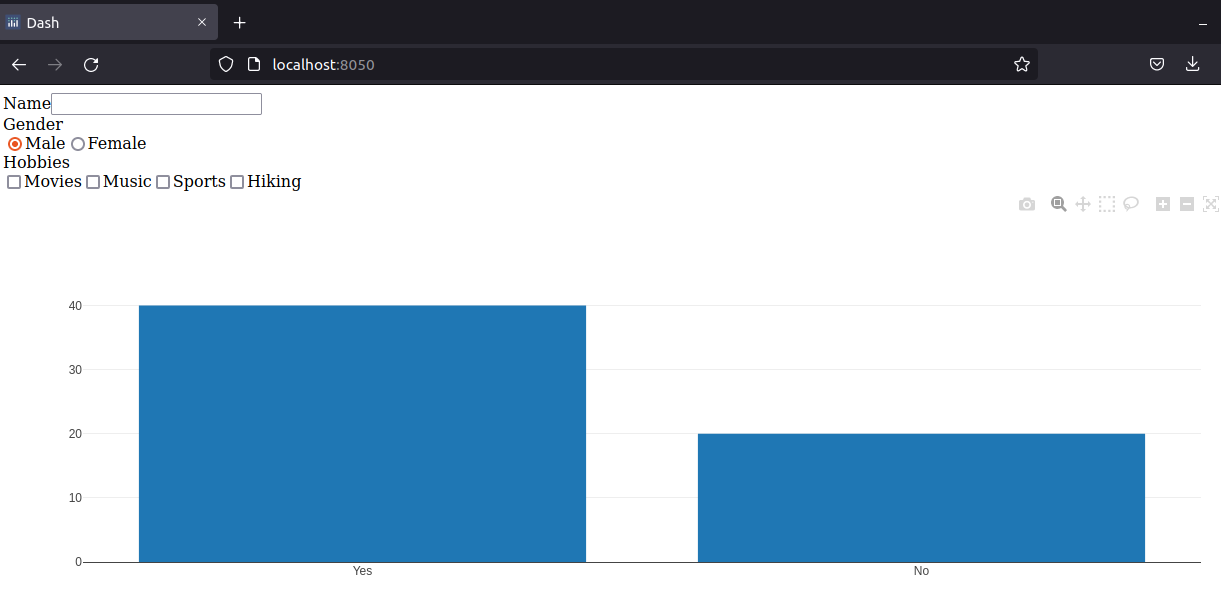
We import the required libraries in the code above and create a Dash web app object. We then set the object’s layout to an HTML Div component that is the root element of our app. Inside it, we add labeled input, radio group, checkbox, and graph Dash core components before running the server in debug mode.
The Graph core component is used for creating client-side visualizations in Dash. The Graph object expects a plotly Figure object with the graph/visualization to be rendered, which can be provided directly from plotly or using dictionaries.
Dash layout components example
It is time for the flashier Dash web app promised earlier, showing the usage of Dash HTML and core components, including the Dash Graph core component. In the code, we shall pass the Figure object required by the Graph component for visualization as dictionaries.
In the code shown, we shall visualize two datasets. The first will be 100 randomly selected numbers plotted as a line chart, and the other will load the bank_processed.csv dataset and plot the outcome of the campaign as a bar chart.
The Dash layout will consist of two heading tags and two graph/chart visualizations. The ids are recommended since React uses them for rendering the Dash HTML and core layout components.
#dasher4.py
#import required libraries
import dash
from dash import html, dcc
import pandas as pd
import numpy as np

# create 10 values from 0-100 increasing monotonically by a step of 10
x = np.linspace(0,100,10)
#set the random seed to get same random values between runs
np.random.seed(9)
#create 10 random values between 100-500
y = np.random.randint(100,500,10)
#show the shape of the resulting numpy arrays
print(x.shape)
print(y.shape)

#read the csv data into a pandas dataframe
df = pd.read_csv('bank_processed.csv')
print(df.head())
#group outcomes by the value of the column deposit_yes
outcomes_series = df.groupby('deposit_yes')['poutcome_success'].count()
print('outcomes:',outcomes_series)
#get the number of no
depo_count_no = outcomes_series[0]
#get the numbers of yes
depo_count_yes = outcomes_series[1]
#list of outcomes labels
xdata = ['No','Yes','Total']
#list of outcomes counts
ydata = [depo_count_no,depo_count_yes,df.shape[0]] #[5873,5289,11162]

#web app and visualization
app = dash.Dash()
app.layout = html.Div(children=[ #root div element
 html.H3(style={'textAlign': 'center'}, children='Random Line Plot'), #inline styled header element (dash html component)
 dcc.Graph(id='viz2', figure={ #graph element (dash core component)
  'data': [{'x': x, 'y': y}]
  }),
 html.H3(style={'textAlign': 'center'}, children='Bank Dataset Analysis'), #inline styled header element (dash html component)
 dcc.Graph(id='viz1', figure={ #graph element (dash core component)
  'data': [{'x': xdata, 'y': ydata, 'type': 'bar'}]
  })
])
#start the web app server
app.run_server(debug=True)
The output from the code is shown below:
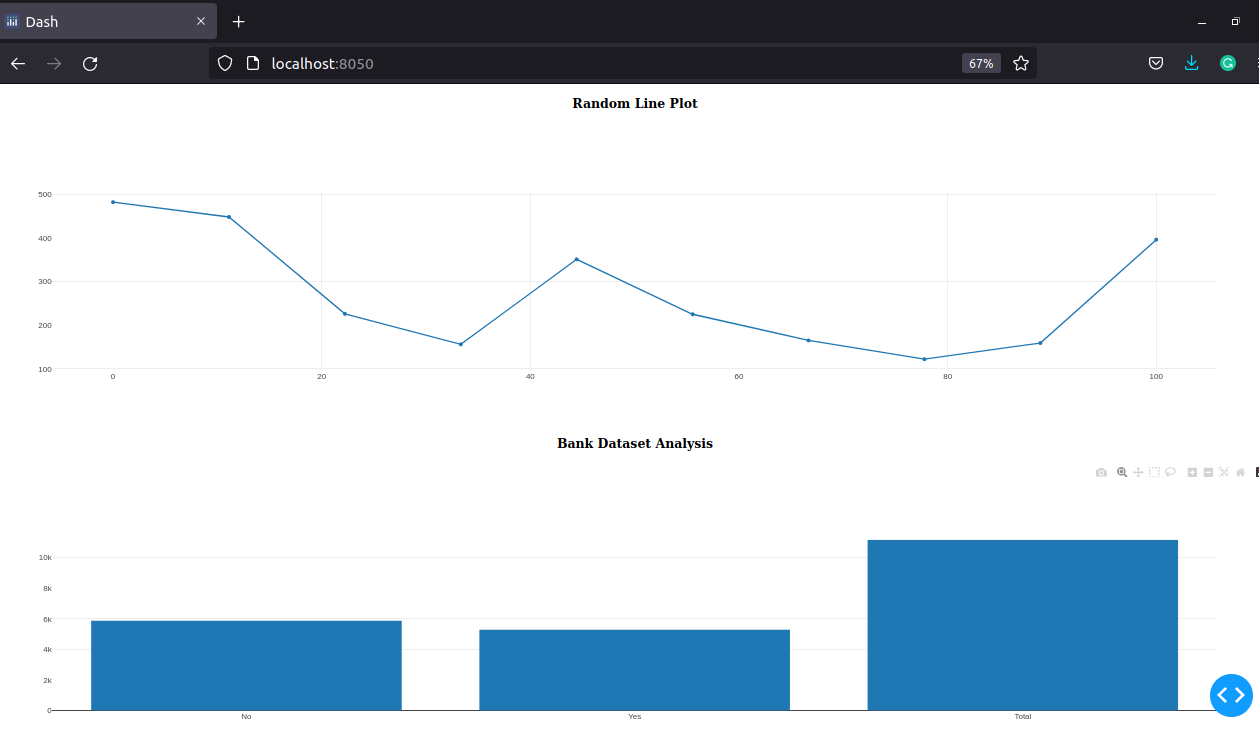
Hovering over the data points in the line chart or the boxes in the bar plot results in a popup with more information about the specific data point. This is part of the interactivity provided out-of-the-box by Dash. Not too bad, with all the visualization and web app functionality requiring only ten lines of code (strictly three, but who is counting?).
Summary
In this tutorial, we have looked at how to install and get started with Dash. We learned about one of dash’s three core concepts, Dash layout, the others being Dash callbacks and Dash state.
Dash layout is concerned with the presentational layer and is composed of Dash HTML components and Dash core components. They correspond to the contents of the DOM of an HTML page.
We have taken a blitz tour of the Dash library’s layout. In later tutorials, we look at Dash callbacks and state and cover Dash in more depth.
A TIP FROM THE EDITOR: For another way to do Data Visualization, check our Data Visualization With Google Charts article.
Gain Debugging Superpowers
Unleash the power of session replay to reproduce bugs and track user frustrations. Get complete visibility into your frontend with OpenReplay, the most advanced open-source session replay tool for developers.
