

Adding maps is an interesting option for any web app, and today this isn’t so hard as before, due to libraries such as Leaflet.js, as this article shows.

Discover how at OpenReplay.com.
Maps are great for a variety of things, most importantly, navigating through places. Unlike physical maps, digital maps are now on the rise due to their accessibility and handiness. To make things better, digital maps are now interactive, with features that make navigating a lot easier.
Digital maps also offer dynamic features that enhance user engagement, boost businesses and organizations’ communication, and allow them to compete more effectively.
These maps can be incorporated into websites to improve user experience. One way to do this is with the JavaScript package Leaflet.js.
What is Leaflet.js?
Leaflet.js is a lightweight JavaScript library that enables dynamic maps in web applications. The best part is that it is free to use, easily customizable, and can be used for any location worldwide. Popular sites such as Fiverr, Booking, Pinterest, etc., use it to integrate interactive maps.
Despite its small size, it has various features that make it stand out, such as tiled web maps, markers, zooming features, popups, search, heatmap, etc.
React-leaflet is a package that allows Leaflet.js to be easily integrated into web applications. The package provides React components for Leaflet.js and ensures flawless integration with React’s ecosystem, enabling developers to leverage React’s props and components.
Why are interactive maps important in websites?
Interactive maps play a crucial role in enhancing website usability and engagement. Here are some reasons why they are essential:
- Improved user engagement: Interactive maps provide users with a dynamic and engaging experience, allowing them to easily explore geographical data. They offer intuitive controls and features that enhance exploration and understanding of spatial information.
- Better navigation: With these, users can zoom in and out of locations, plan routes, and explore different alternative paths, enhancing their understanding of the area and facilitating navigation. This is particularly useful for websites and applications offering location-based services.
- Additional contact information: Incorporating maps on websites makes it easier for customers to locate businesses and their different locations, especially when addresses might be difficult to find. Providing map locations on the Contact Us page improves user experience and encourages interaction.
Encouraging user visits
By integrating maps into an application, businesses can indirectly encourage users to visit physical locations, such as stores, restaurants, or attractions.
- Portable use: Digital maps are compatible across various devices and screen sizes, ensuring a consistent user experience regardless of the device used. Whether accessed on a desktop, tablet, or smartphone, users can enjoy seamless navigation and exploration, enhancing accessibility and convenience.
- Visualization of location: Interactive maps help users visualize routes, landmarks, and other geographical features, improving website accessibility and user understanding. By presenting information spatially, maps offer insights into locations, enhancing user comprehension and engagement.
- Promotion of local services: Maps can highlight local businesses, attractions, and services, attracting users to explore the area further and promoting local commerce. By showcasing nearby amenities and points of interest, maps encourage users to discover new places and experiences, fostering community engagement and economic growth.
Best scenarios to add a map into an application
Below are the best cases for adding a map to an application:
- Travel website: For traveling websites, adding a map is important for travelers/tourists who want to find different places to visit. Tourism sites use maps to show popular tourist destinations and allow users to easily navigate their location, encouraging users to explore more.
- E-commerce website: Incorporating maps into e-commerce websites is beneficial for stores that operate both physically and online. These maps assist customers in locating nearby stores, pick-up points, or distribution centers, thereby enhancing convenience and accessibility for shoppers looking to purchase products or pick up orders in person.
- Real estate application: Real estate websites can use maps to provide comprehensive information to users searching for properties. These maps display property listings, neighborhood details, and nearby amenities, helping users make informed decisions about their property search by visualizing the location and surrounding features.
- Location tracking: Applications offering location-based services, such as food delivery or ride-sharing, benefit from integrating maps for real-time tracking and navigation. By providing users with accurate route optimization and estimated arrival times, these maps enhance user experience and efficiency, ensuring seamless and timely service delivery.
- Event management: Websites organizing events, conferences, or festivals leverage maps to streamline event planning and attendee navigation. These maps showcase event venues, parking areas, and nearby accommodations, facilitating logistical arrangements and helping attendees easily navigate the event site.
Getting started with Leaflet.js
As usual, create your application and navigate to it:
npx create-react-app leaflet-react-map && cd leaflet-react-mapInstall the needed libraries with npm or yarn:
npm install leaflet react-leafletAfter cleaning up your application, it will be ready for use.
Basic map display with React
Create a new component for the map.
import { MapContainer } from 'react-leaflet'

const Map = () => {

  return (

    <MapContainer center={[51.505, -0.09]} zoom={13}>
      {/* Map content */}
    </MapContainer>
  )
}

export default Map;
In this component, everything is wrapped in the MapContainer component provided by react-leaflet. We specify our map’s center coordinates (in latitude and longitude) and initial zoom level.
We must include a map tile layer (TileLayer from react-leaflet) to display something on the map. We’ll use OpenStreetMap as our free map provider by specifying its URL:
...
   <MapContainer center={[51.505, -0.09]} zoom={13} style={{ height: '400px' }}>
      <TileLayer url="https://{s}.tile.openstreetmap.org/{z}/{x}/{y}.png" />
    </MapContainer>
...
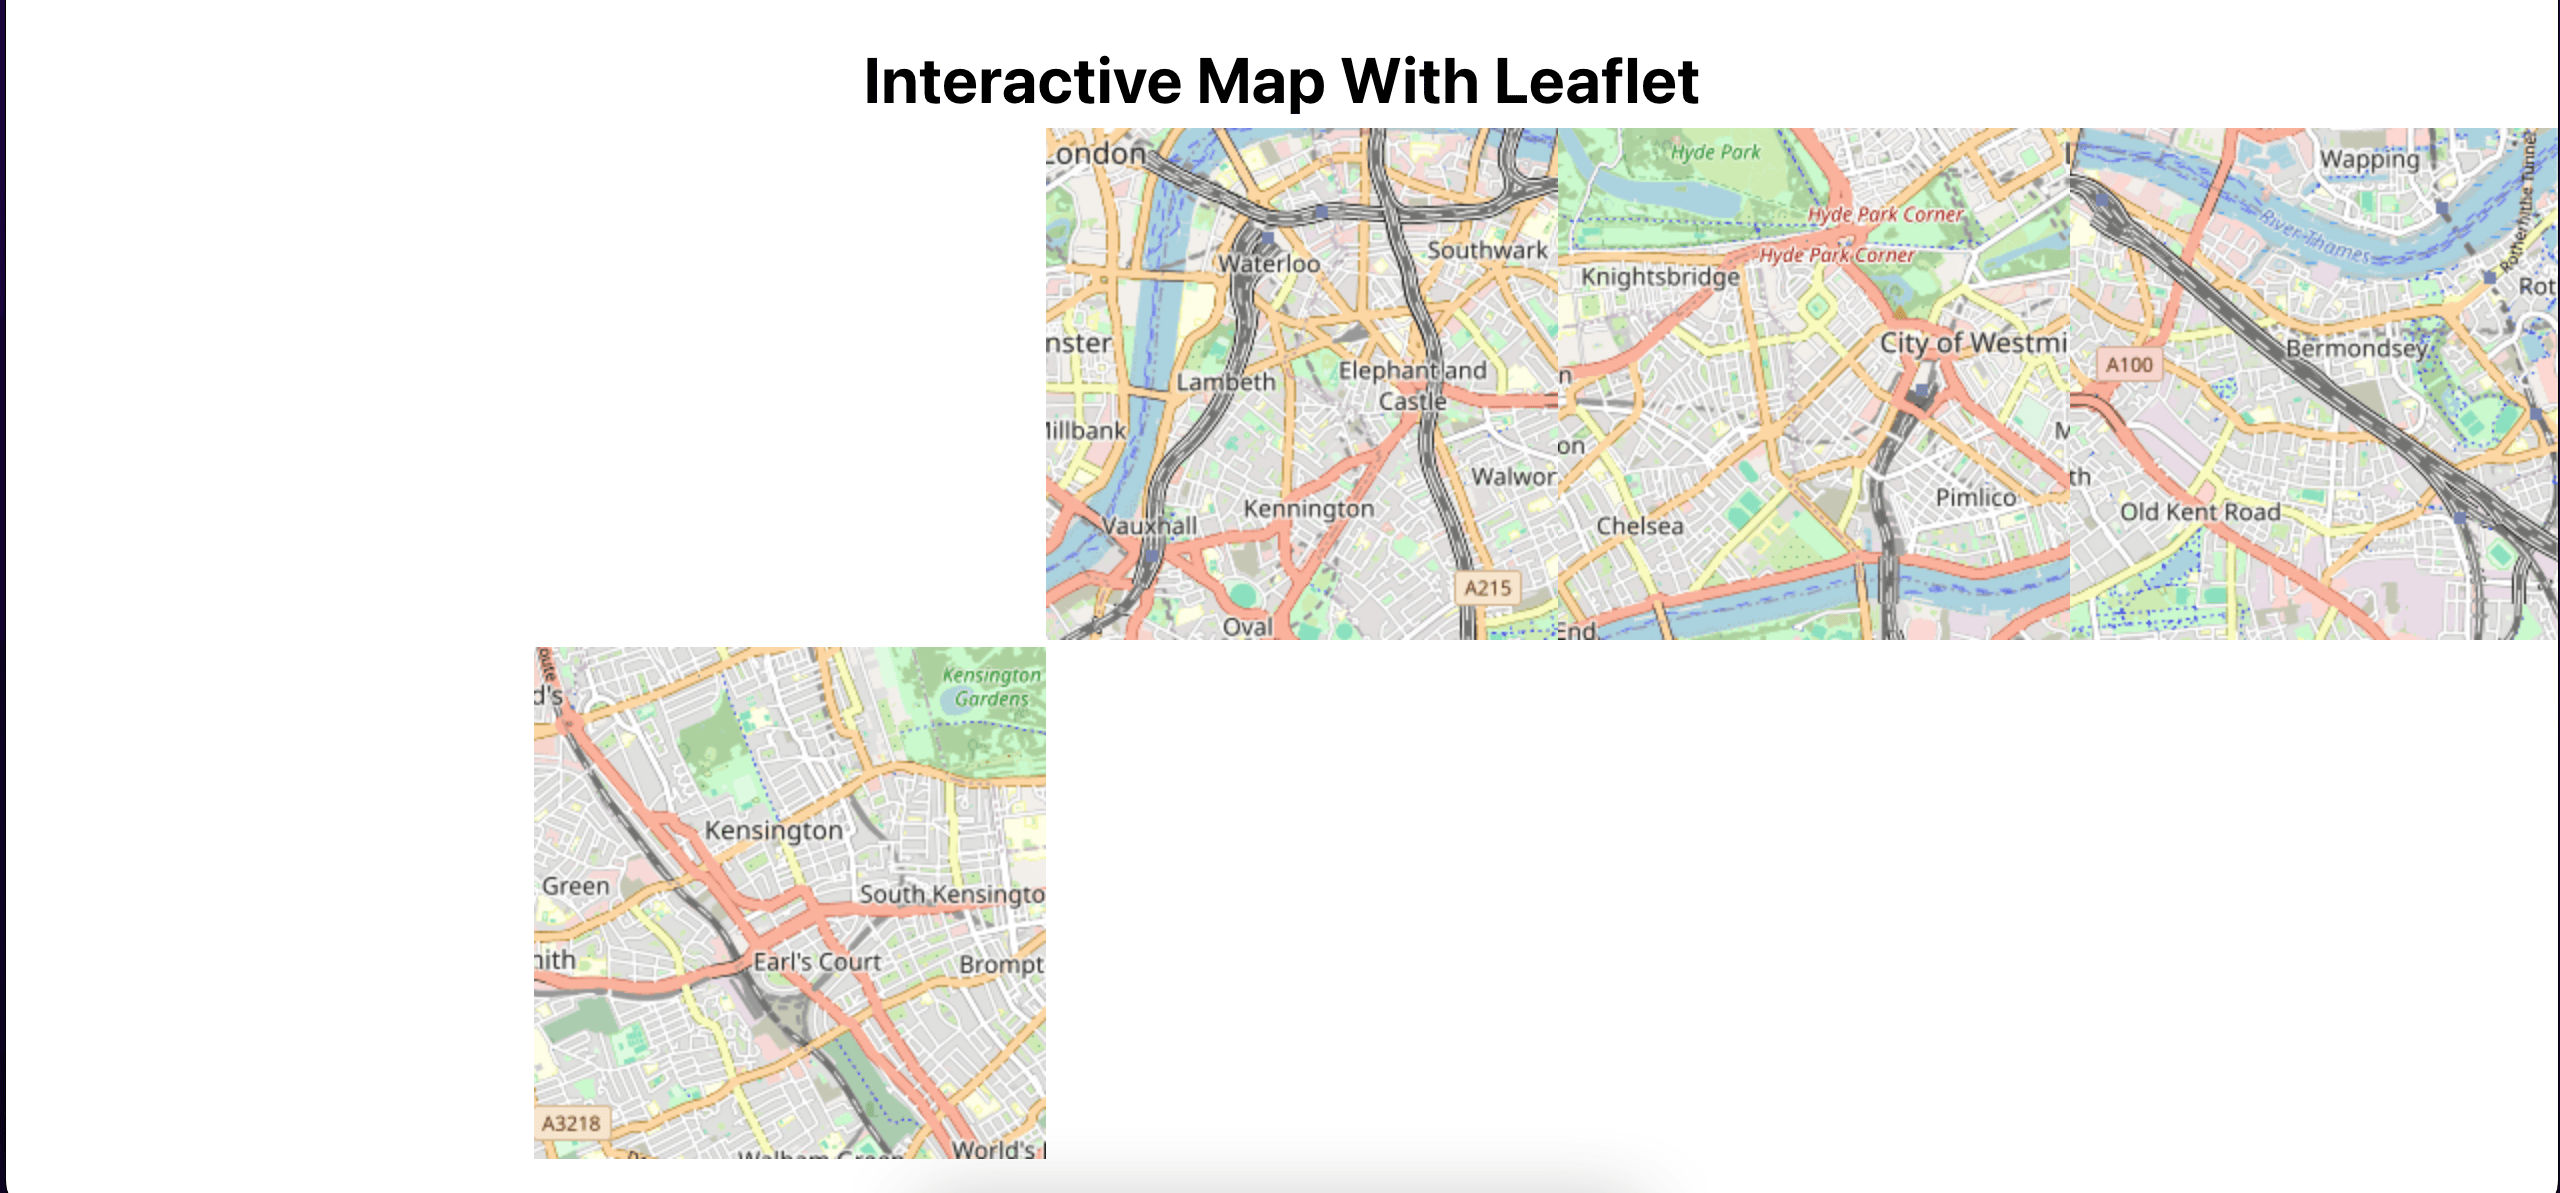
The map appears, but it isn’t responsive and appears distorted. To make it show correctly, you need to use the styling provided by Leaflet. Once the import for the styling is added, the map disappears. But once the style attribute is added on the MapContainer, it changes to normal.
import React from "react";

import "leaflet/dist/leaflet.css"; // Leaflet stylesheet

import { MapContainer, TileLayer } from "react-leaflet";
...

 <MapContainer center={[51.505, -0.09]} zoom={13} style={{height: '400px'}}>
...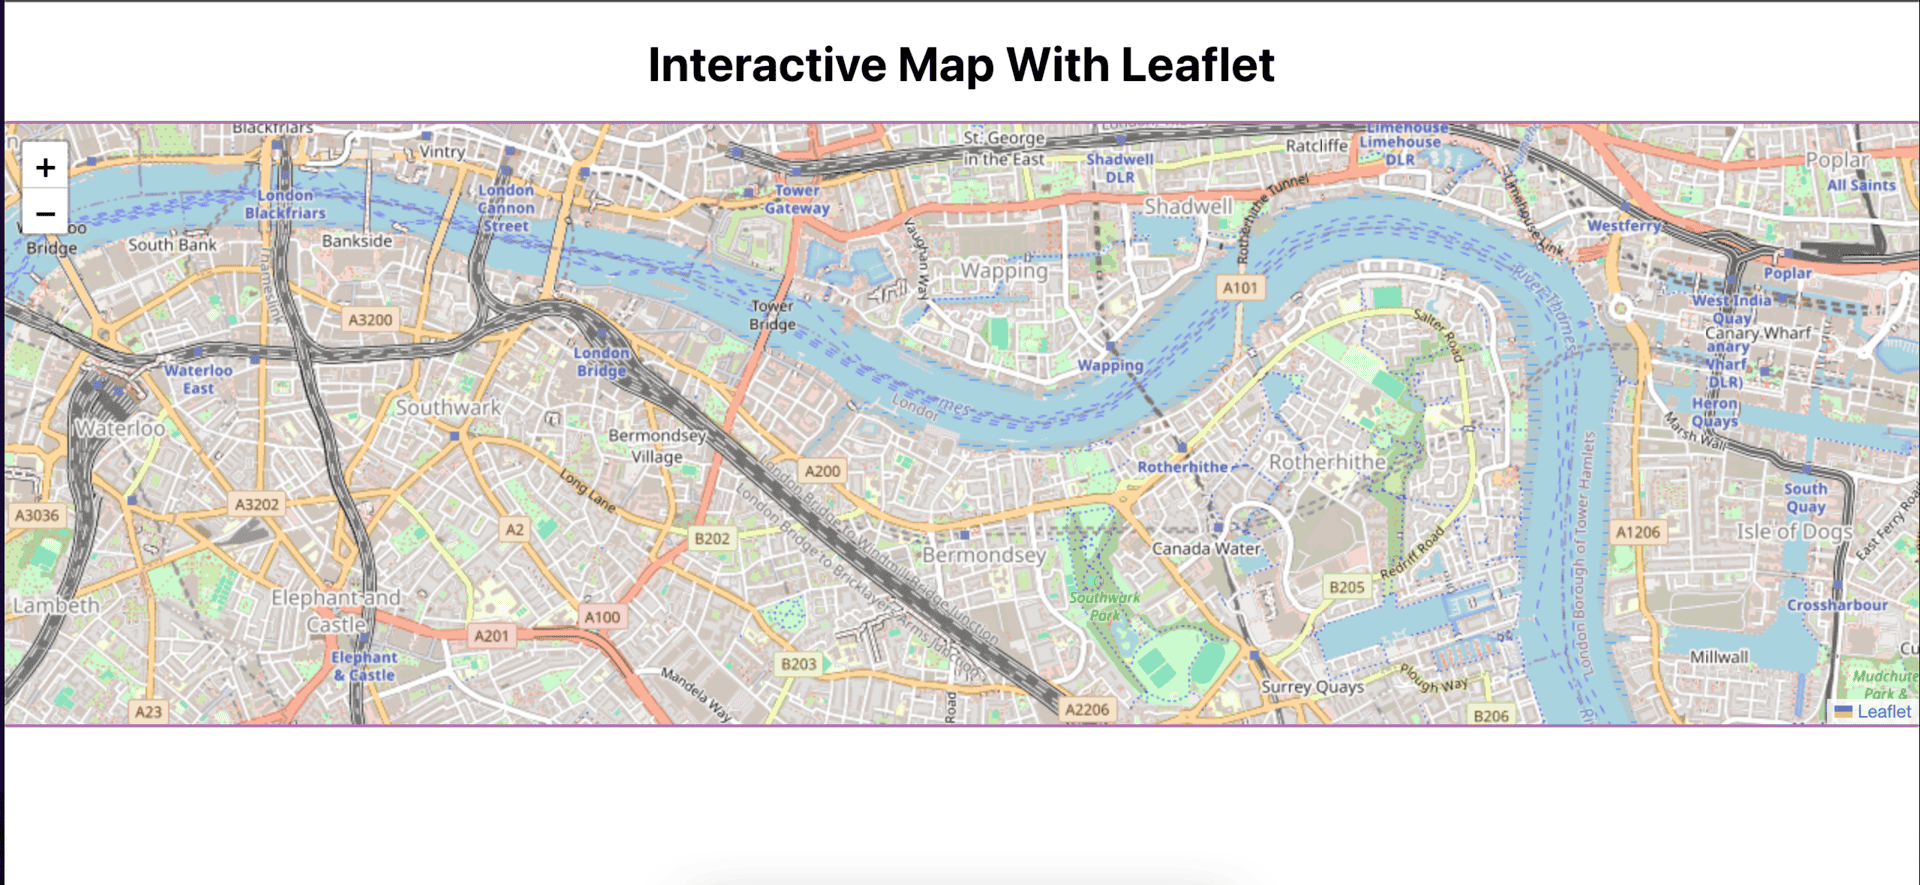
Now, the map is showing fine. Try double-clicking on the map to zoom it in. You can also drag the map to view other places available. Pinch to zoom out.
Adding markers and popups to the map
Now that the basic map is displayed, we can add other features. Markers are a group of points on the map around to the initial center point. To add markers to the map, geocode (location) will be used to calculate the position value. For popups, popUp should be provided. Each marker is an array containing the longitude and latitude of a location, and a pop-up is a string displayed when the marker is clicked or hovered over. Make sure to import Marker and Popup from react-leaflet:
import React from "react";
import "leaflet/dist/leaflet.css";
import { MapContainer, TileLayer, Marker, Popup } from "react-leaflet";

const Map = () => {
  // MARKERS ARRAY FOR EASE
  const markers = [
    {
      geocode: [51.55, -0.09],
      popUp: "Pop up for marker 1",
    },
    {
      geocode: [51.5, -0.1],
      popUp: "Pop up for marker 2",
    },
    {
      geocode: [51.49, -0.08],
      popUp: "Pop up for marker 3",
    },
  ];

  return (
    <MapContainer
      center={[51.505, -0.09]}
      zoom={13}
      style={{ height: "400px" }}
    >
      <TileLayer url="https://{s}.tile.openstreetmap.org/{z}/{x}/{y}.png" />
      {/* MARKERS */}
      {markers.map((marker) => (
        <Marker position={marker.geocode}>
          <Popup>{marker.popUp}</Popup>
        </Marker>
      ))}
    </MapContainer>
  );
};

export default Map;
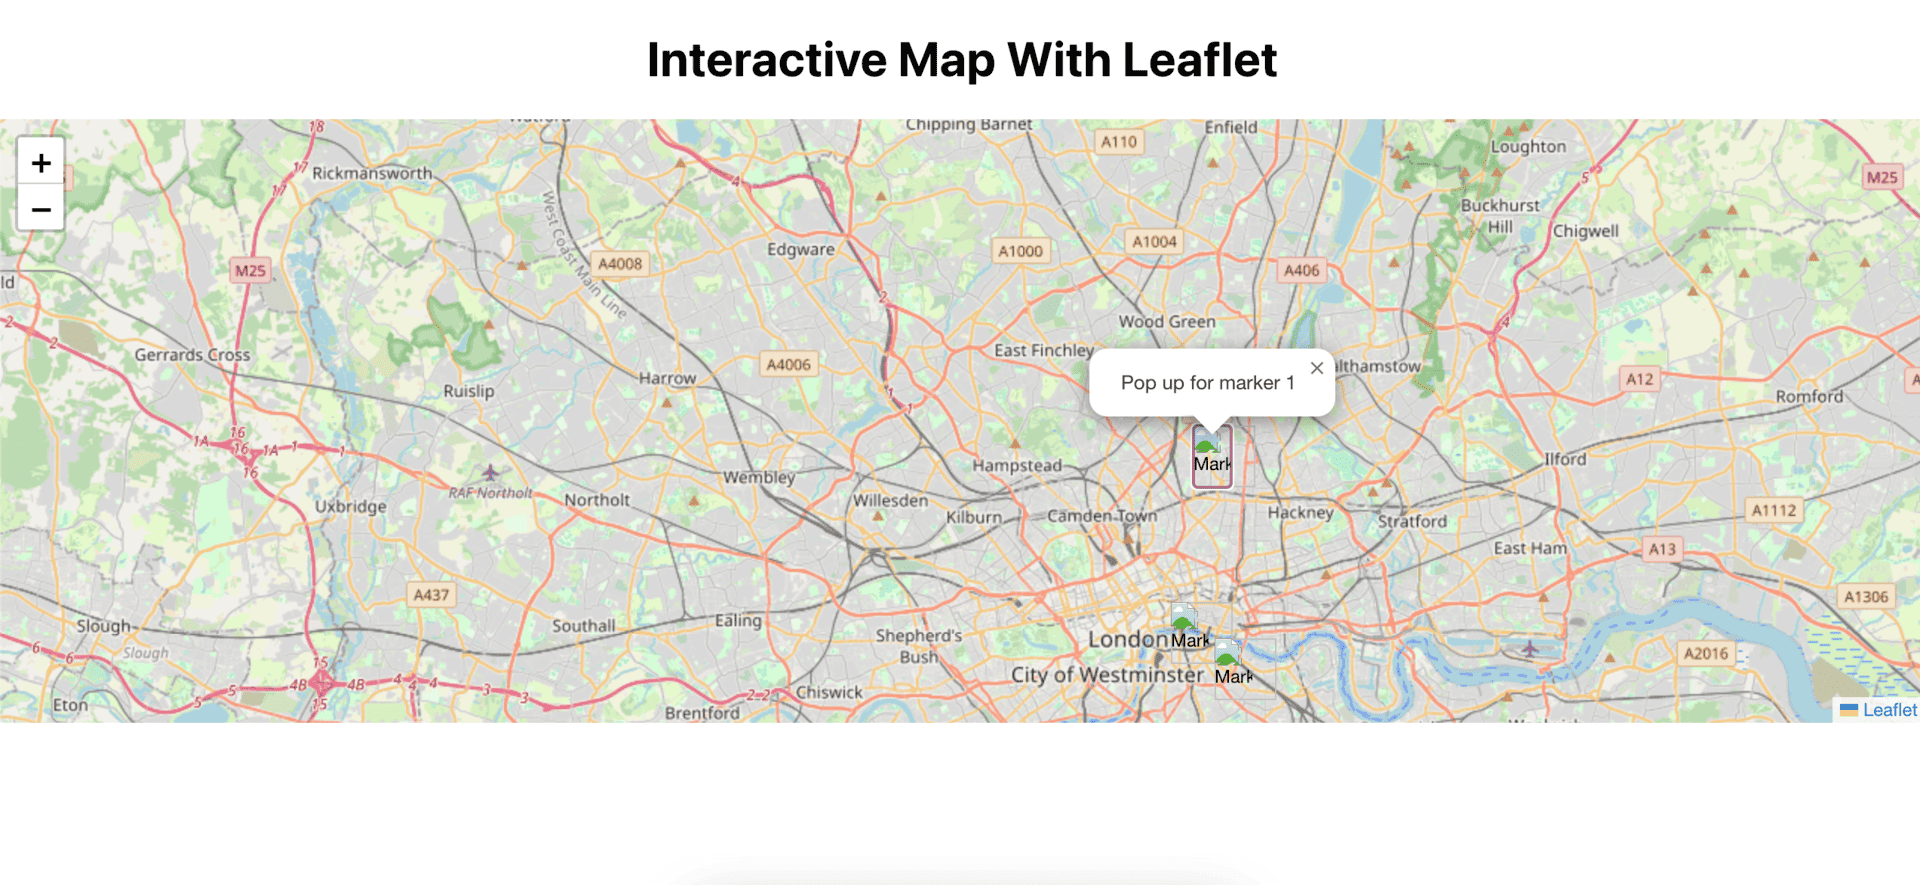
Although the marker and popup work, no image is shown for the marker. Leaftlet needs its marker to be customized to be displayed.
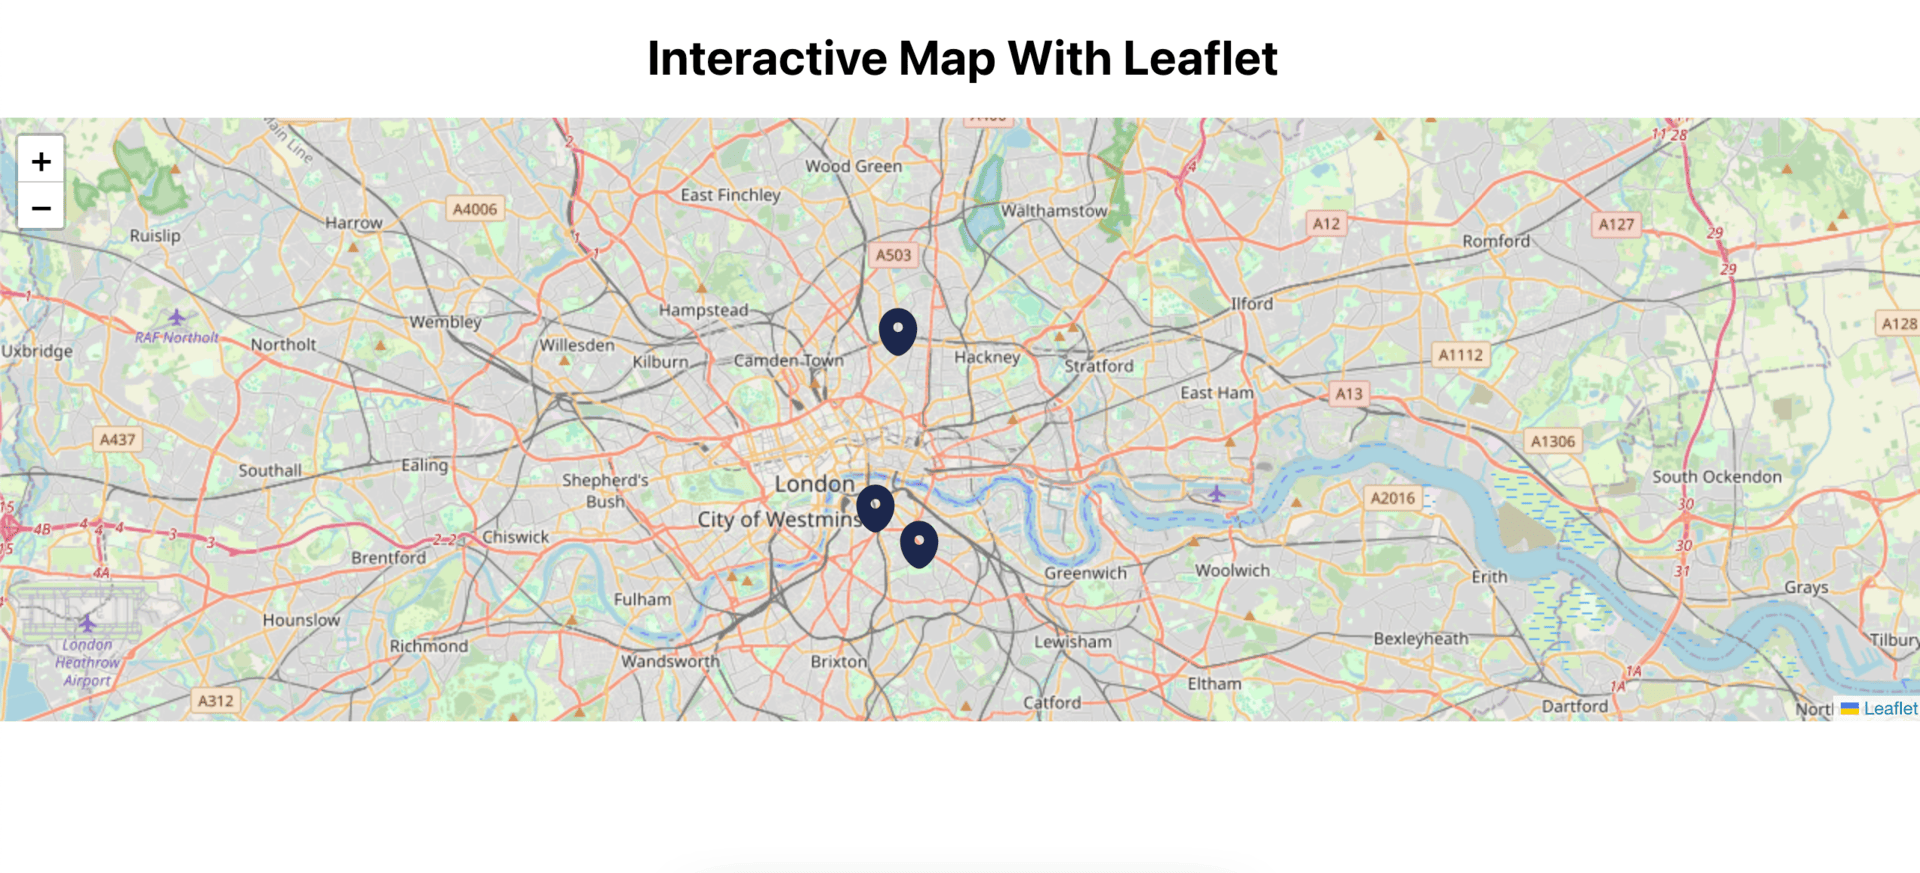
Customizing markers on the map
To customize the icon, first import Icon from the leaflet library and create a new instance of the Icon class. An Icon instance requires two key-value pairs in its object: the iconUrl (in string), which can be downloaded and imported or simply use the URL of the icon, and the iconSize (an array of numbers representing pixels)
...
import { Icon } from "leaflet";

const Map = () => {
  // CUSTOM ICON
  const customIcon = new Icon({
    iconUrl: "https://www.svgrepo.com/show/526024/map-point.svg",
    iconSize: [38, 38]
  });

...
    <Marker position={marker.geocode} icon={customIcon}>
...
Adding interactivity to the map
Leaflet.js enables the incorporation of various interactive features, enhancing the usability and engagement of your maps. Some of these features include:
- Event Handling: Respond to different user events like clicks, drags, and zooms with ease, making your map more intuitive to use. By handling these events, users are empowered to interact with the map easily, providing a smooth experience for them.
- Layer Toggling: This allows users to customize their experience by toggling between different map layers or data overlays, catering to their interests. Users can switch between layers to explore different perspectives of the geographical data, enhancing the map’s usability.
- Dynamic Data Visualization: Leaflet.js supports dynamic data visualization by integrating with real-time data sources. This enables the creation of dynamic visualizations such as heatmaps and animated overlays, which provide users with up-to-date and interactive representations of spatial data.
Advanced features
Besides the features stated above, Leaflet.js offers more advanced functionalities and plugins. These include:
- GeoJSON support: GeoJSON is a format for representing geographical data. Leaflet’s native support for GeoJSON simplifies parsing and displaying complex spatial information on maps.
- Clustering: Improve performance and readability for large datasets by automatically grouping nearby markers into clusters. This can be implemented by using an additional package:
react-leaflet-cluster. - Heatmaps: Heatmaps in Leaflet.js visualize spatial patterns and density distributions using color gradients to represent data intensity. With this, areas with low or high activity can be easily identified and visualized.
- Integration with External APIs: Leaflet.js allows you to seamlessly integrate with external services to enhance your map’s functionality. This includes features such as geocoding, routing, and spatial analysis, expanding the capabilities of your map application to better serve your users’ needs.
Conclusion
Interactive maps are such a great way to enhance your website. Leaflet.js offers flexibility and versatility, with easy integration plugins available for various languages like PHP, Java, etc. Developers of all skill levels can leverage Leaflet.js without the need to manage API keys or encounter usage limits.
While this article covers the essential aspects of the Leaflet.js library, it’s important to note that Leaflet.js offers a wide range of features and functionalities. Explore its documentation to unlock the full potential of this powerful tool and integrate interactive maps into your applications.