SVG vs. Canvas: A comparison
A comparison between these two image-creation technologies

Canvas and SVG are two of the most commonly used technologies for creating and displaying graphics on web pages. This article will compare them, showing the pros, cons, and usage, so you can decide when and where to use each of them.
Two of the most widely used web-based techniques for displaying graphics and images are SVG and Canvas. Both of these are web standards for producing engaging web experiences. Because SVG is resolution independent and consists of shapes, lines, and text, it can be scaled up or down without losing quality. For interactive, data-driven, and personalized applications, SVG graphics and images are perfect. On the other hand, bitmaps are used to store image data in the resolution-dependent raster graphics API called Canvas. Drawing shapes and images on web pages is a common practice, and making interactive games, animations, and visualizations is easy with Canvas.
What are SVG and Canvas?
The majority of contemporary browsers support SVG, a vector graphic format based on XML. It works well for creating straightforward graphics and diagrams that can be resized without pixelation. Additionally, JavaScript can be used to create interactive graphics using SVG. SVG is a two-dimensional vector image format relying on the XML standard. It is frequently used in web design and development to create and manage vector graphics like logos, diagrams, and icons. SVG images, as opposed to conventional raster images like JPEG, PNG, and GIF, can be scaled without sacrificing quality, making them a better option for displaying images on websites and devices with different resolutions. SVG images are additionally compressed, and they load faster than raster images.
Canvas is an HTML5 feature that makes it possible to create dynamic, interactive graphics for the web. Because it is raster-based, it is best suited for producing more intricate visualizations and animations, like data visualizations. When an image is scaled up too much on Canvas, which is not a vector-based format like SVG, it may become pixelated. Canvas offers a resolution-dependent bitmap canvas for dynamically displaying graphs, game graphics, and other visuals. Using JavaScript, it is possible to draw graphics directly on a website. The canvas element is nothing more than a holding area for graphics.
SVG and Canvas differ primarily in that SVG uses vector-based image formats, while Canvas uses raster-based image formats. Paths—the lines, curves, and shapes that make up SVG images—are created using mathematical equations. This makes them easily manipulable and infinitely scaleable. Contrarily, canvas images are composed of pixels, which are tiny squares of color that are arranged next to one another to create an image. Because canvas images depend on their resolution, they become pixelated and blurry as they are enlarged.
Limitations of using SVG and Canvas
SVG and Canvas are both powerful tools for creating interactive graphics, but there are some limitations to consider when deciding which to use.
SVG is limited in its ability to create complex shapes and interactivity because it relies on a DOM-based system for transforming and manipulating the individual elements that comprise an image. Furthermore, due to its inability to handle large amounts of data efficiently, SVG is not ideal for creating highly dynamic animations.
Canvas, on the other hand, renders images more directly and is better suited for complex shapes. Additionally, it is quicker than SVG, which makes it perfect for quick animations. Canvas, on the other hand, lacks the same DOM-based structure as SVG, making it less effective at manipulating graphics than SVG. Additionally, the limited accessibility support offered by Canvas makes it more challenging to guarantee that your content is accessible to all users.
Comparison: SVG vs. Canvas
We’ll compare SVG and Canvas in depth in this section. This section will teach you a lot. Comparisons will be made based on Scalability, Size and Load Time, Interactivity, Performance, Accessibility, Learning Curve, and Popularity.
Scalability
The two most popular vector graphics standards are SVG and Canvas. While they are both used to create vector graphics, they are not the same. The scalability of SVG and Canvas will be compared in this article.
SVG SVG’s scalability is generally considered to make it superior to Canvas for the creation of vector graphics. SVG can be scaled up or down without losing quality because it is a resolution-independent vector graphics format. Additionally, it can support interaction and animation.
Canvas Canvas, on the other hand, is a raster graphics format that is resolution-independent. This means it is not as easily scalable as SVG, and when the graphics are scaled up, the quality suffers. Canvas also doesn’t have native support for effects like filters and masks.
Size and load time
There are numerous factors to consider when deciding between SVG and Canvas for graphical representations, including size, load time, and compatibility.
SVG Because SVG files are small in size, they are ideal for web pages with a lot of graphical content. Furthermore, because they are typically text-based and processed by the browser, they load quickly. SVG is compatible with all modern browsers, but some extra work may be required to ensure backward compatibility with older versions.
Canvas Canvas elements are typically significantly larger than SVG files. As a result, they take longer to load and can degrade web page performance. Canvas, despite its size disadvantage, remains a popular choice for graphical representations due to its support for animation and interactivity. Canvas is also compatible with all modern browsers and does not require any additional work for backward compatibility.
In the climax, when it comes to size and load time, SVG is the better option. Because of the smaller file size and faster loading time, it is a better choice for web pages with a lot of graphical content. Canvas, on the other hand, may be a better choice when more advanced features such as animation and interactivity are desired.
Interactivity
Comparing SVG and Canvas is a critical step in understanding the differences between these two powerful technologies. Although both SVG and Canvas are used to create two-dimensional graphics, they differ significantly in terms of interactivity.
SVG is an example of a declarative language, which means that the elements and corresponding behavior can be defined directly in the code. This makes it simple for developers to incorporate interactive elements into vector graphics. Developers, for example, can bind various events to an SVG element, such as mouse clicks, keystrokes, and other user interactions. Additionally, SVG supports a wide range of animation effects, which can be used to create a dynamic and engaging user experience.
Canvas, on the other hand, is a procedural language, which means that it needs instructions from the developer to perform the desired behavior. Canvas becomes more difficult to use for interactive tasks as a result because developers must manually code the corresponding behavior for each element. Canvas, on the other hand, has a few advantages over SVG, such as the ability to draw bitmap images and create 3D effects.
Performance
When contrasting the performance of SVG and Canvas, there are many different things to take into account. Scalable Vector Graphics, or SVG, is a vector image format that uses XML as its foundation. Since it is an open standard, anyone can produce and utilize SVG files. Interactive images, animations, and games can be made using the JavaScript APIs available in the HTML5 element known as Canvas.
SVG typically outperforms Canvas in terms of performance for shapes and simple drawings. SVG files are resolution independent, which means they can be scaled without sacrificing quality. Additionally, SVG images can be cached in a browser’s memory, reducing loading times.
Canvas, on the other hand, usually performs better for complex drawings and animations. Images can be drawn quickly and without loss of quality using Canvas. Furthermore, the JavaScript API is optimized for canvas manipulation, allowing for faster animations. Finally, it is dependent on the specific use case. SVG is the way to go if you’re dealing with shapes and simple drawings. Canvas is probably the better option for more complex drawings and animations.
Accessibility
In terms of accessibility, SVG and Canvas are both viable options. And in this section, we’ll talk about SVG and Canvas accessibility.
SVG is a vector-based technology, which means it is resolution independent. This makes it ideal for use in responsive websites, as the images will scale to different screen sizes. SVG images are accessible by default because they are text-based and can be read by screen readers. Developers can also add attributes to the elements in the SVG code to make it more accessible.
Canvas is a raster-based technology, which means it is resolution-dependent. As a result, Canvas images look better on higher-resolution devices. Canvas images are not accessible by default, but developers can make them so by using ARIA attributes. These attributes should be applied to any interactive elements on the page.
In summary, both SVG and Canvas are viable web graphics options that can be made accessible with the proper coding. The best technology for your needs is determined by the type of graphic and the device you intend to use.
Learning curve
Canvas and SVG (Scalable Vector Graphics) learning curves can vary greatly depending on the user’s familiarity with programming principles. Canvas is considered more complex than SVG because it relies on JavaScript and the requirement to understand the various functions and syntaxes. The user must understand concepts such as styling, properties, and drawing functions in order to draw on a canvas.
SVG, on the other hand, is often thought to be less complicated than Canvas, but it also necessitates an understanding of markup structure and syntax. For example, creating an SVG shape necessitates knowledge of attributes and elements such as path, line, and rest. Another significant difference between the two technologies is that SVG has more support for web standards, such as accessibility, whereas Canvas has limited support for accessibility features.
To sum up, the learning curve for Canvas and SVG is determined by the user’s programming knowledge and markup structure. Working with Canvas and SVG can be simple for those with more experience. However, for those without programming experience, learning the fundamentals of both technologies may require more effort.
Popularity
Canvas and SVG are becoming increasingly popular as tools for creating interactive web content. Canvas and SVG are both open standard web graphics technologies. They both have advantages and disadvantages, so it is critical to understand the differences between the two before deciding which to use.
Canvas is supported by the majority of modern browsers and is simple to use. The canvas’s main advantage is that it allows you to quickly and easily create graphics and animations. However, the canvas is not as flexible as SVG and only supports limited animation.
SVG is more powerful and flexible than Canvas, allowing for the creation of detailed and complex graphics. SVG also supports animation and interactive elements, making it an excellent choice for complex and interactive web design. SVG is also more accessible than Canvas because it can be read by screen readers.
Application use cases for SVG and Canvas
SVG and Canvas are HTML5 APIs for rendering vector and raster graphics, respectively. SVG is used to create vector-based graphics, whereas Canvas can render both vector and raster graphics. Canvas is better for quickly rendering graphics and animations with less control than SVG. One application for SVG could be the creation of interactive map systems for use on websites. Because SVG is a vector format, users can zoom in and out of maps without pixelation or distortion. SVG also supports smooth animations, which can be used to depict movement on a map.
Canvas can be used to render games because it gives you a lot of control and flexibility. Canvas, for example, can be used to render a game’s environment, characters, and animations. It can also be used for physics simulations and artificial intelligence calculations.
SVG and Canvas can also be used to create data visualizations for websites, with SVG being better for creating detailed charts and Canvas being better for creating charts quickly with less control.
Recommendation on when to use SVG and Canvas
SVG and Canvas are two web technologies that are used to create and draw graphics on the internet. Canvas is commonly used to create graphics, animations, and games, whereas SVG is commonly used to create scalable vector graphics. It is critical to consider the complexity of the graphics when deciding between SVG and Canvas. SVG is the most efficient choice for simple graphics such as shapes and logos. It is also the best option for increased scalability and performance while maintaining scalability with multiple resolutions. Canvas, on the other hand, is best suited for dynamic and interactive graphics. This includes making animations, showing videos, and developing interactive games. Canvas is also more efficient when working with complex graphics or a large number of objects. SVG is better suited to simple graphics, whereas Canvas is better suited to complex, dynamic, and interactive graphics.
Summary of key differences between SVG and Canvas
When it comes to creating graphics for websites, two popular technologies are SVG (Scalable Vector Graphics) and Canvas. The primary distinction between the two is that SVG uses geometric shapes to render graphics, whereas Canvas uses pixels. This means that SVG graphics are resolution-independent, which means they can be resized without losing quality, whereas Canvas graphics become blurry and distorted when resized.
Furthermore, SVG is made up of an official markup language, making it easier to create complex graphics, whereas Canvas requires knowledge of JavaScript to draw more intricate images. SVG is better suited for static images and animation, whereas Canvas is better suited for creating dynamic graphics such as games and real-time applications. In conclusion, SVG and Canvas are two distinct technologies used to create graphics on websites, with SVG being resolution-independent and composed of official markup language, whereas Canvas is composed of pixels and requires knowledge of JavaScript. Each tool has advantages and disadvantages, so the choice will be determined by the project’s specific goals.
What shapes are available in SVG?
SVG allows you to create a variety of shapes. Creating shapes is entirely up to you. SVG can be used to generate the following shapes:
- Rectangles
- Polygons
- Text
- Circles
- Polylines
- Ellipses
- Lines
- Paths
When you use a shape’s points attributes, you can still make other kinds of shapes. The point attributes operate flawlessly when used with polygons.
Session Replay for Developers
Uncover frustrations, understand bugs and fix slowdowns like never before with OpenReplay — an open-source session replay tool for developers. Self-host it in minutes, and have complete control over your customer data. Check our GitHub repo and join the thousands of developers in our community.
What styling can you use on SVG?
The styling options available when using SVG to create shapes will be covered in this section. Working with SVG requires that you use these stylings. SVG can be styled in a variety of ways, including:
Style attribute
Using the style attribute, SVG elements can use the style attribute to apply CSS styles. Using CSS properties, for instance, you can alter the fill color, stroke color, stroke width, opacity, and more.
Here is an illustration of how to use the style attribute in code:
<svg>
  <polygon style="fill: cornflowerblue; stroke: red; stroke-width: 5" />
</svg>
The styles that will be applied to a polygon shape are all that the style attributes’ value in the code above contains. The description of the styles used on the above SVG code can be found below.
- The
fillproperty only affects the shape’s background color. - The outline color of the
strokethat will be created with an SVG is set using thestrokeproperty. - Simply add the
stroke-widthproperty to your styles to set the outline width.
CSS classes
Employing CSS classes, You can create classes with specific styling and apply them to SVG elements using the class attribute of CSS.
Inline CSS
Using the style attribute and directly specifying the styles in the attribute, you can also apply styles to SVG elements using inline CSS.
Presentational attributes
Presentation attributes in SVG also let you apply styles directly to an element. A <rect> element, for instance, can have its fill color specified by setting the “fill” attribute.
External stylesheets
Using the <link> element, you can define styles in an external CSS stylesheet and link them to your SVG.
SVG frequently uses styling elements like fill, stroke, stroke-width, opacity, transform, and others. SVG can also be styled with sophisticated features like gradients, filters, and masks.
How to create shapes with SVG
Creating an SVG in HTML is a straightforward process that requires only a few lines of code. Create an <svg> element, specify the size of the drawing SVG, and then add the shapes, text, and other elements within the <svg> element.
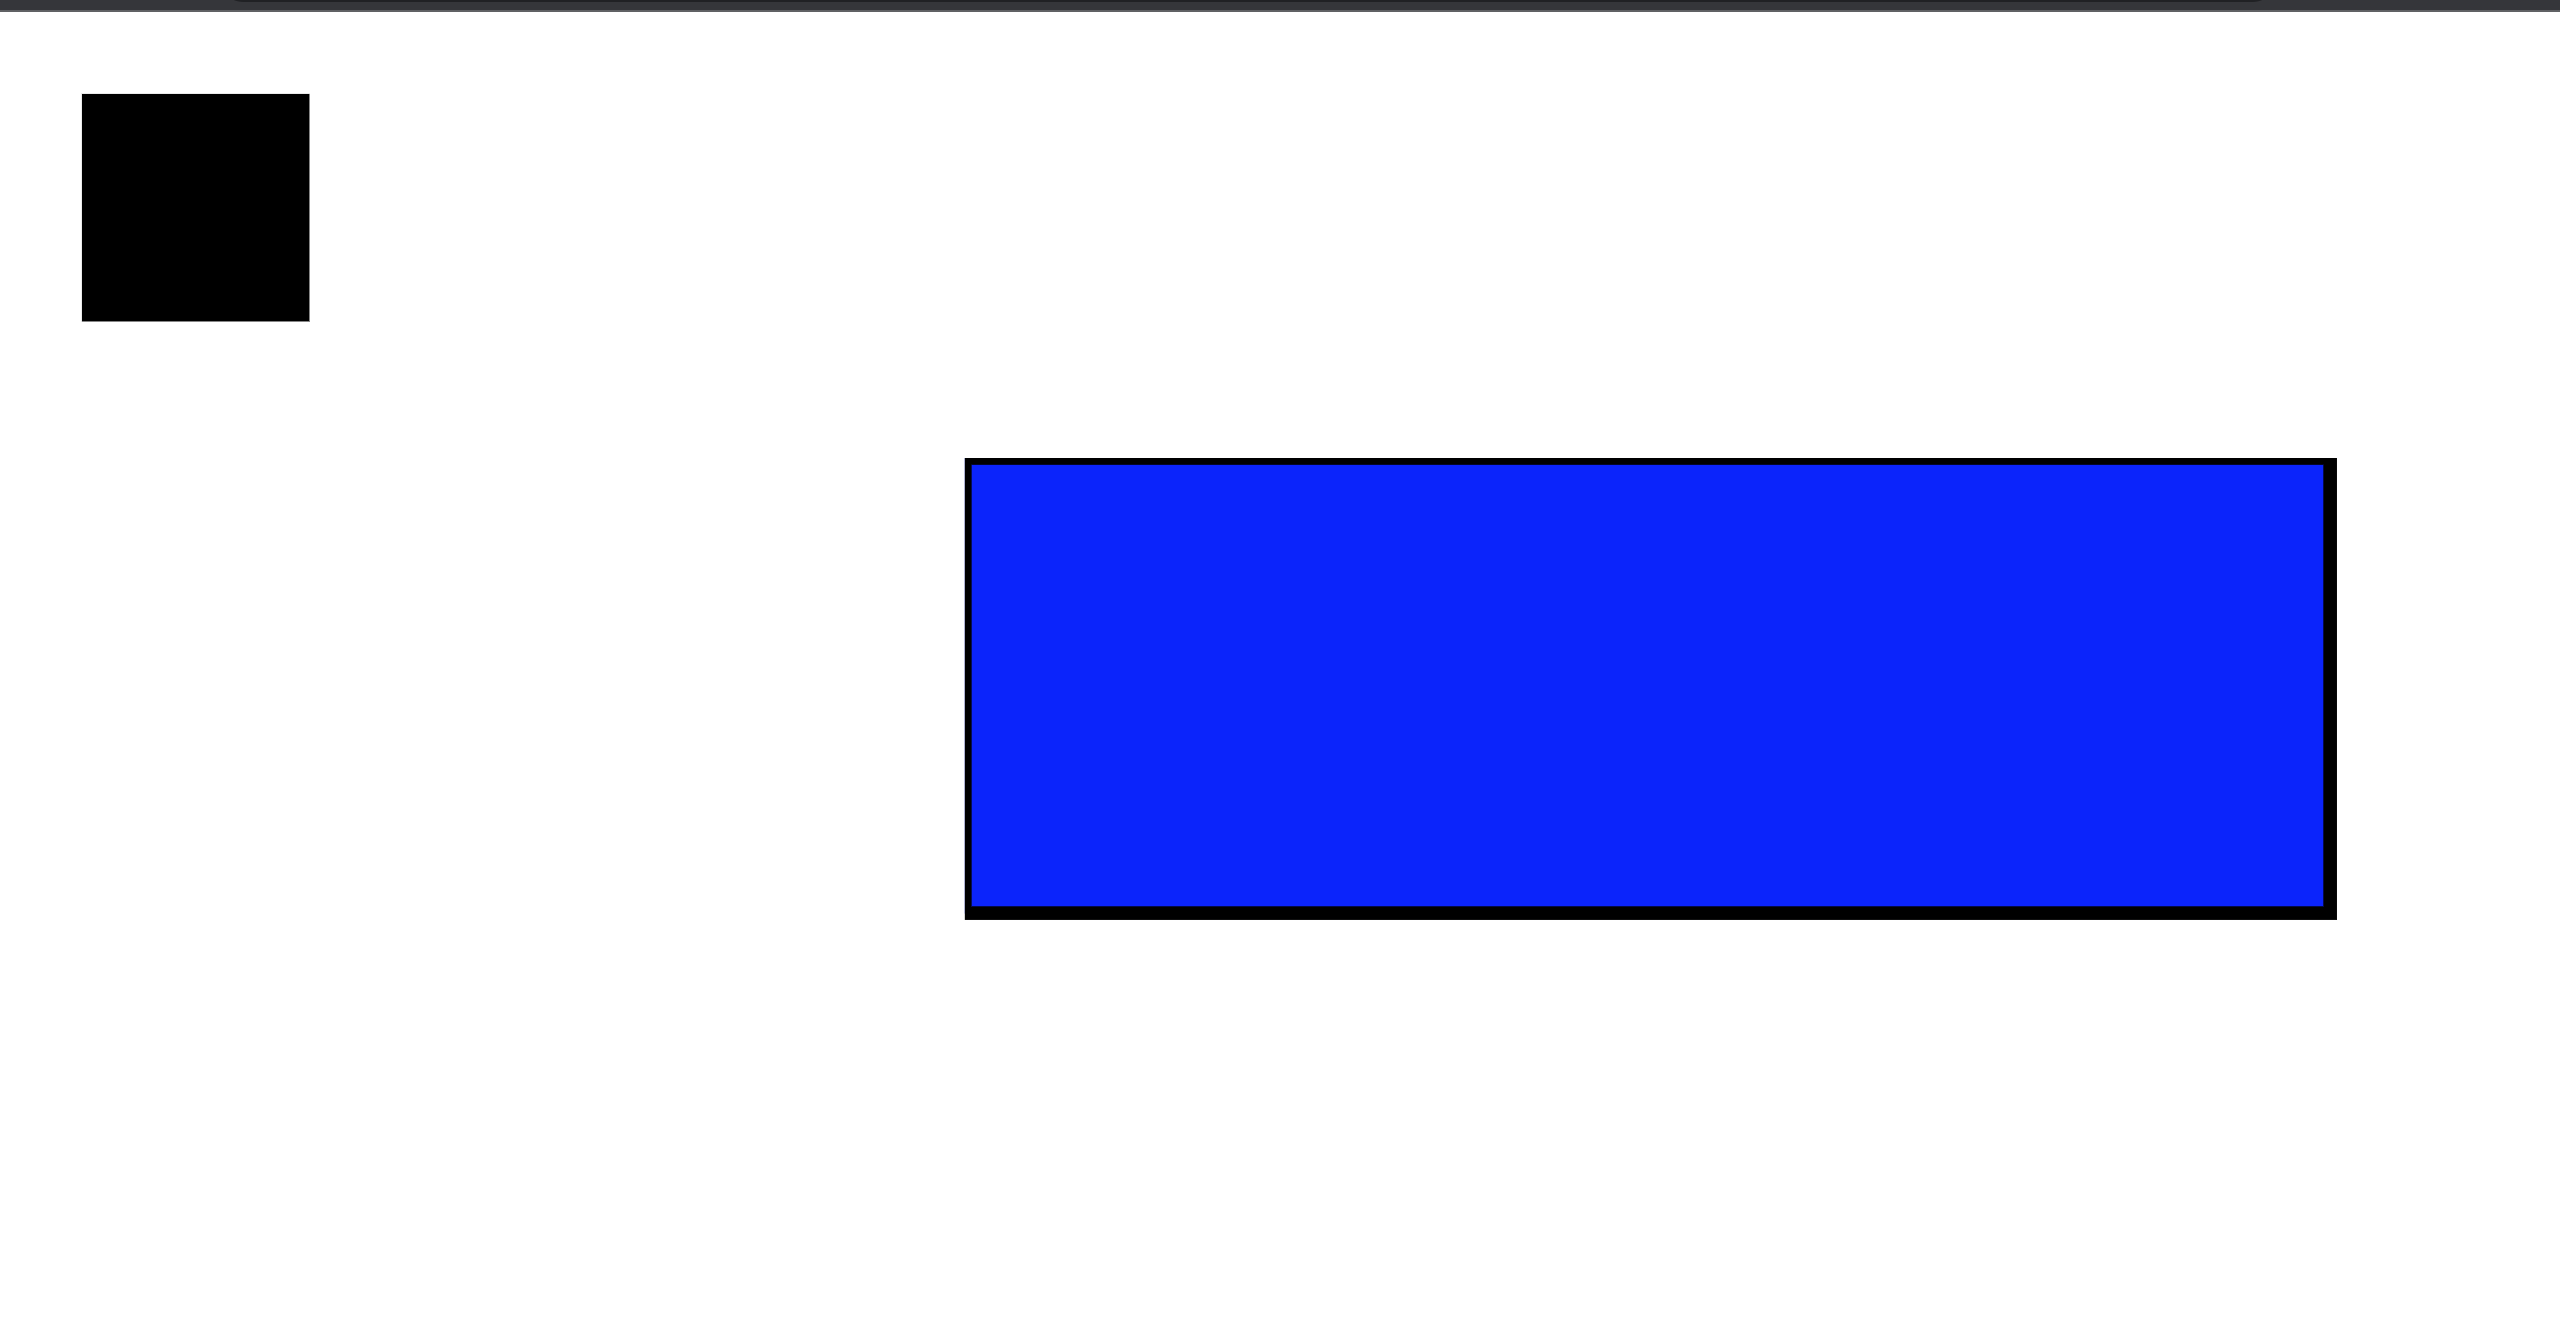
Square and Rectangle
Create an <svg> element first, and specify the size of the drawing canvas. This is accomplished by appending the width and height attributes to the <svg> element. The attributes ‘width’ and ‘height’ are specified in pixels:
<svg width="200" height="200"></svg>Then, within the <svg> element, add the shapes, text, and other elements. This is accomplished by including the appropriate shapes and text elements within the <svg> element. To create a rectangle or square, for example, use the <rect> element:
<svg width="200" height="200">
  <rect x="10" y="10" width="50" height="50" />
</svg>

<svg width="400" height="110">
  <rect
    width="300"
    height="100"
    style="fill: rgb(0, 0, 255); stroke-width: 3; stroke: rgb(0, 0, 0)"
  />
</svg>
Output:
In this section, we’ll be creating different shapes using SVG. These shapes are very easy and not difficult, so let’s get started.
Circle
The circle element, which is very simple for you to use, can be used to create circles. As for the attributes that will be applied to the circle in SVG, they are as follows:
- cy: The
cyattributes represent the circle’s Y coordinates. - cx: Please use the
cxattributes to set the X coordinate. - stroke: To change the color of the circle’s outline, use the
strokeattributes. - stroke-width: The
stroke-widthattributes allow you to specify the width of a circle’s outline.
Let’s draw a circle with SVG:
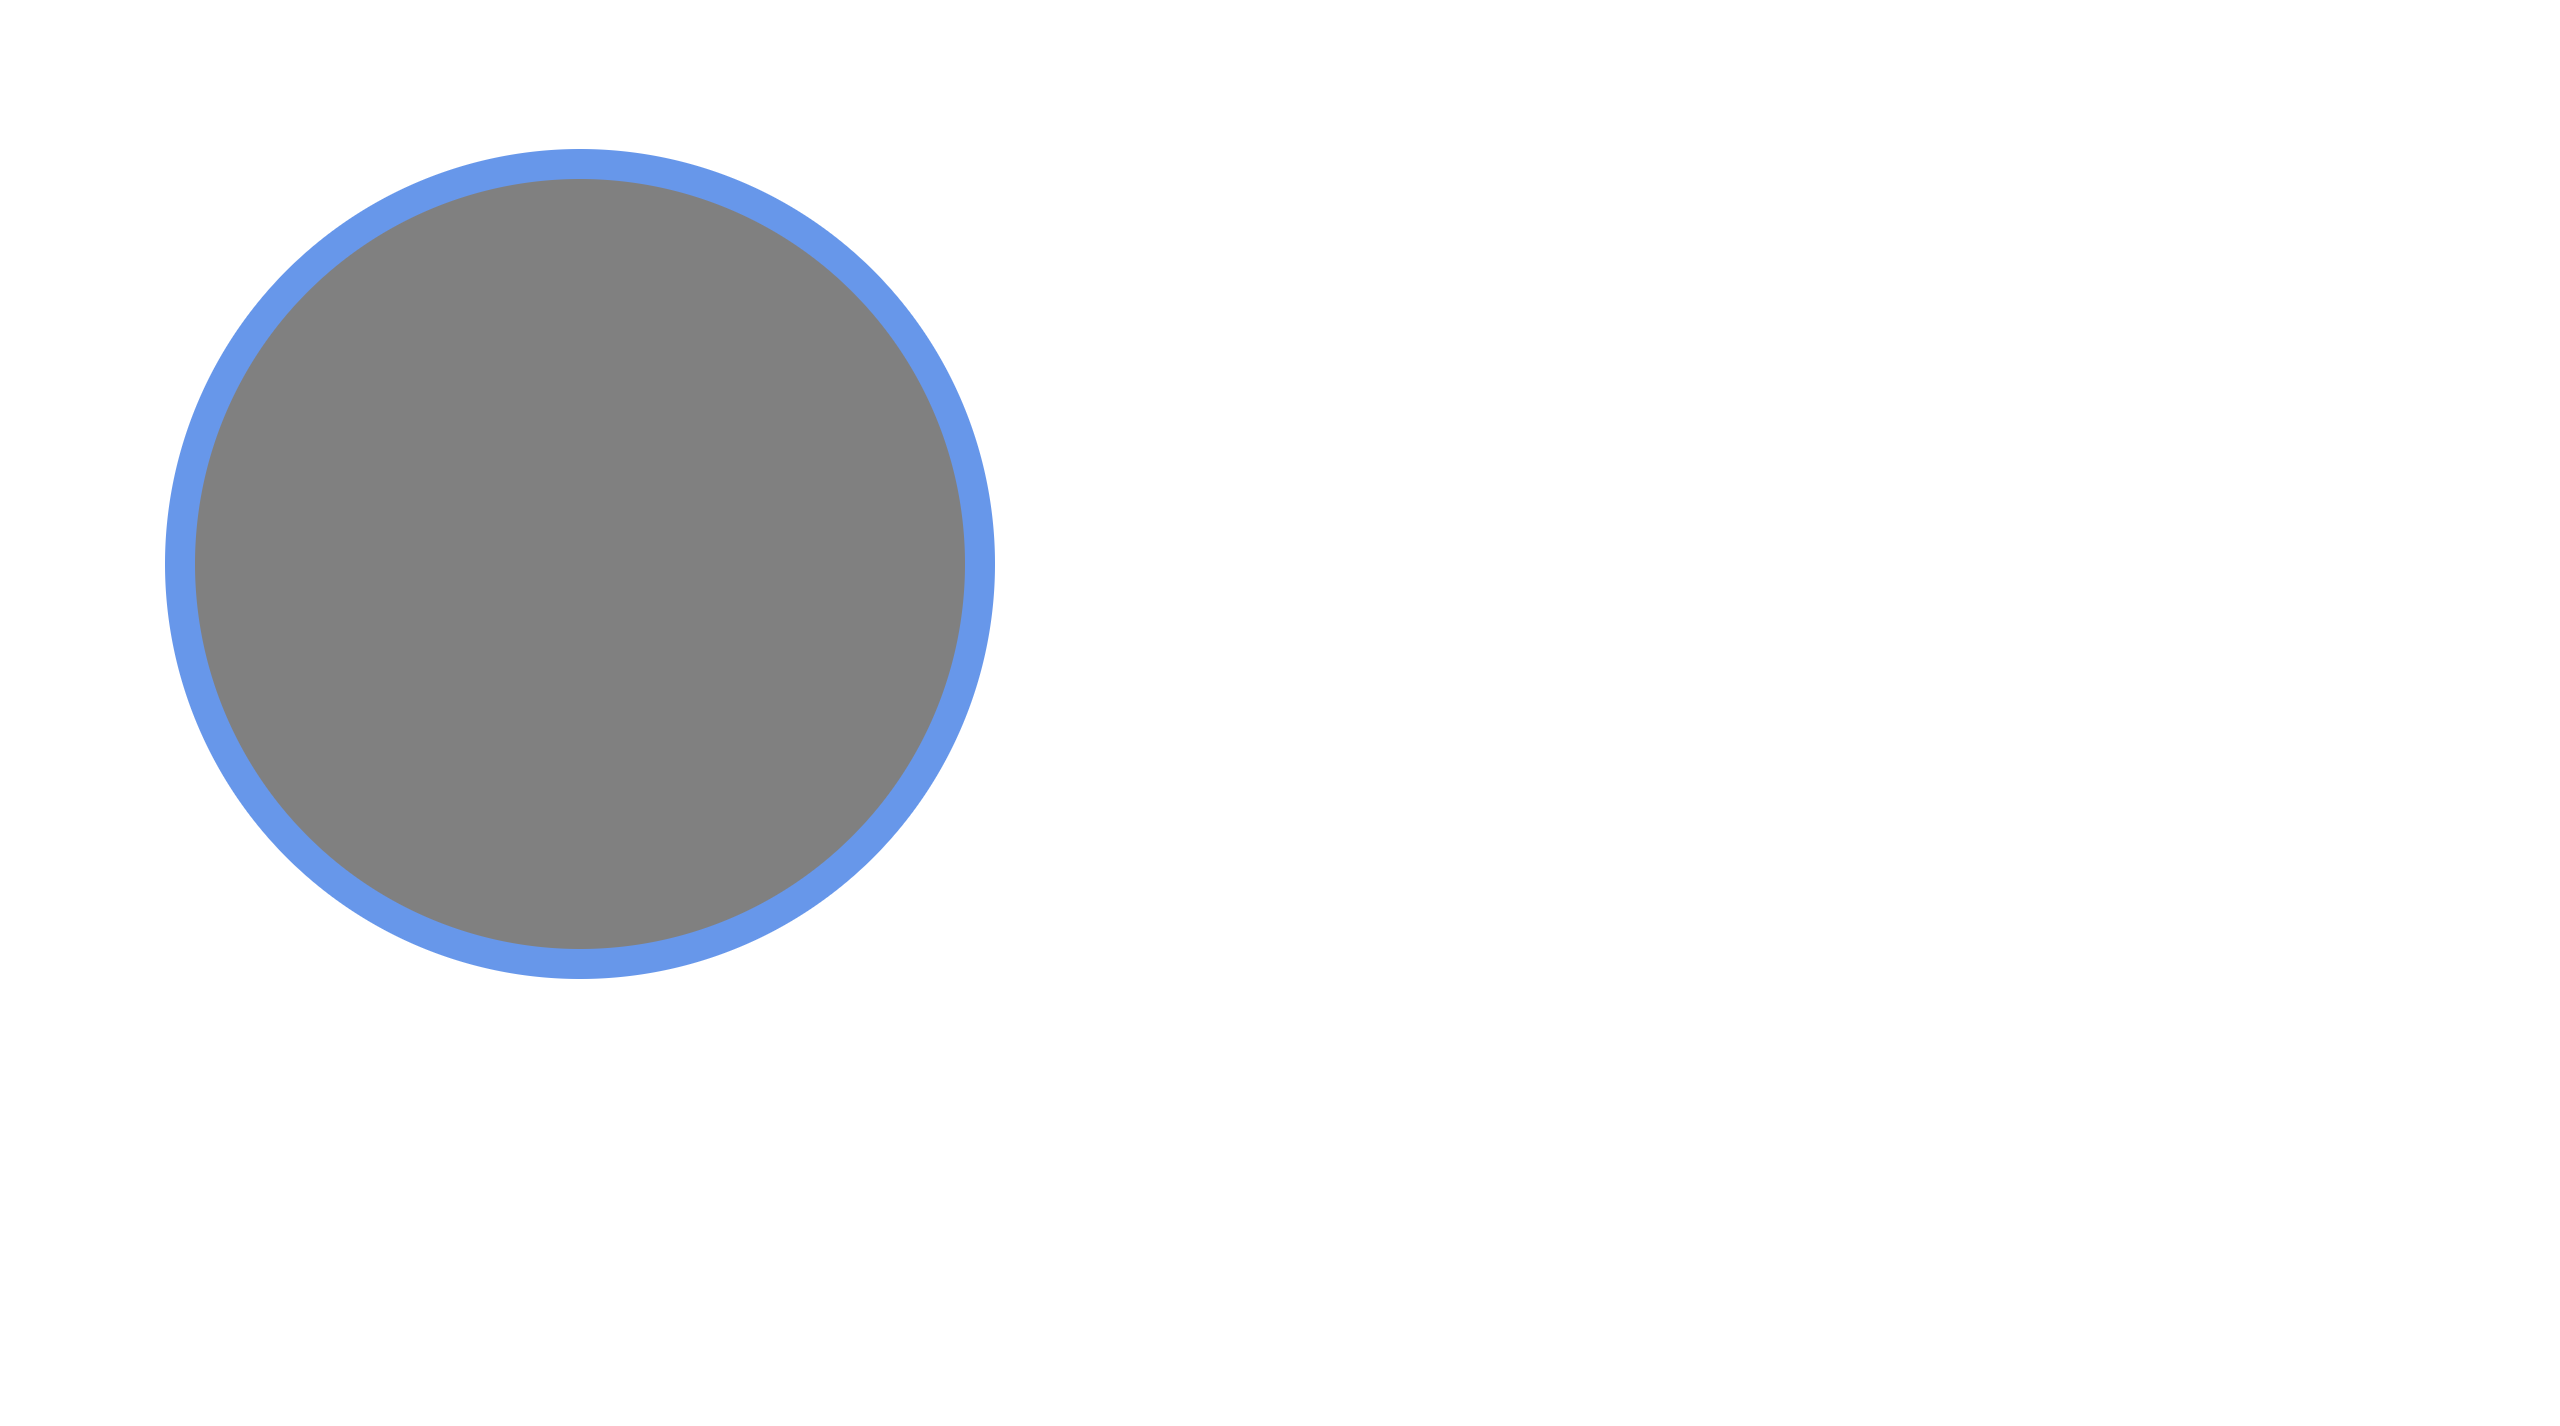
Code:
<svg height="100" width="100">
  <circle
    cx="50"
    cy="50"
    r="40"
    stroke="cornflowerblue"
    stroke-width="3"
    fill="gray"
  />
</svg>
Polygon
Simply use the <polygon> element in SVG to create polygons. You can use the SVG polygon element to create a polygonal shape.
Let’s create a polygon:
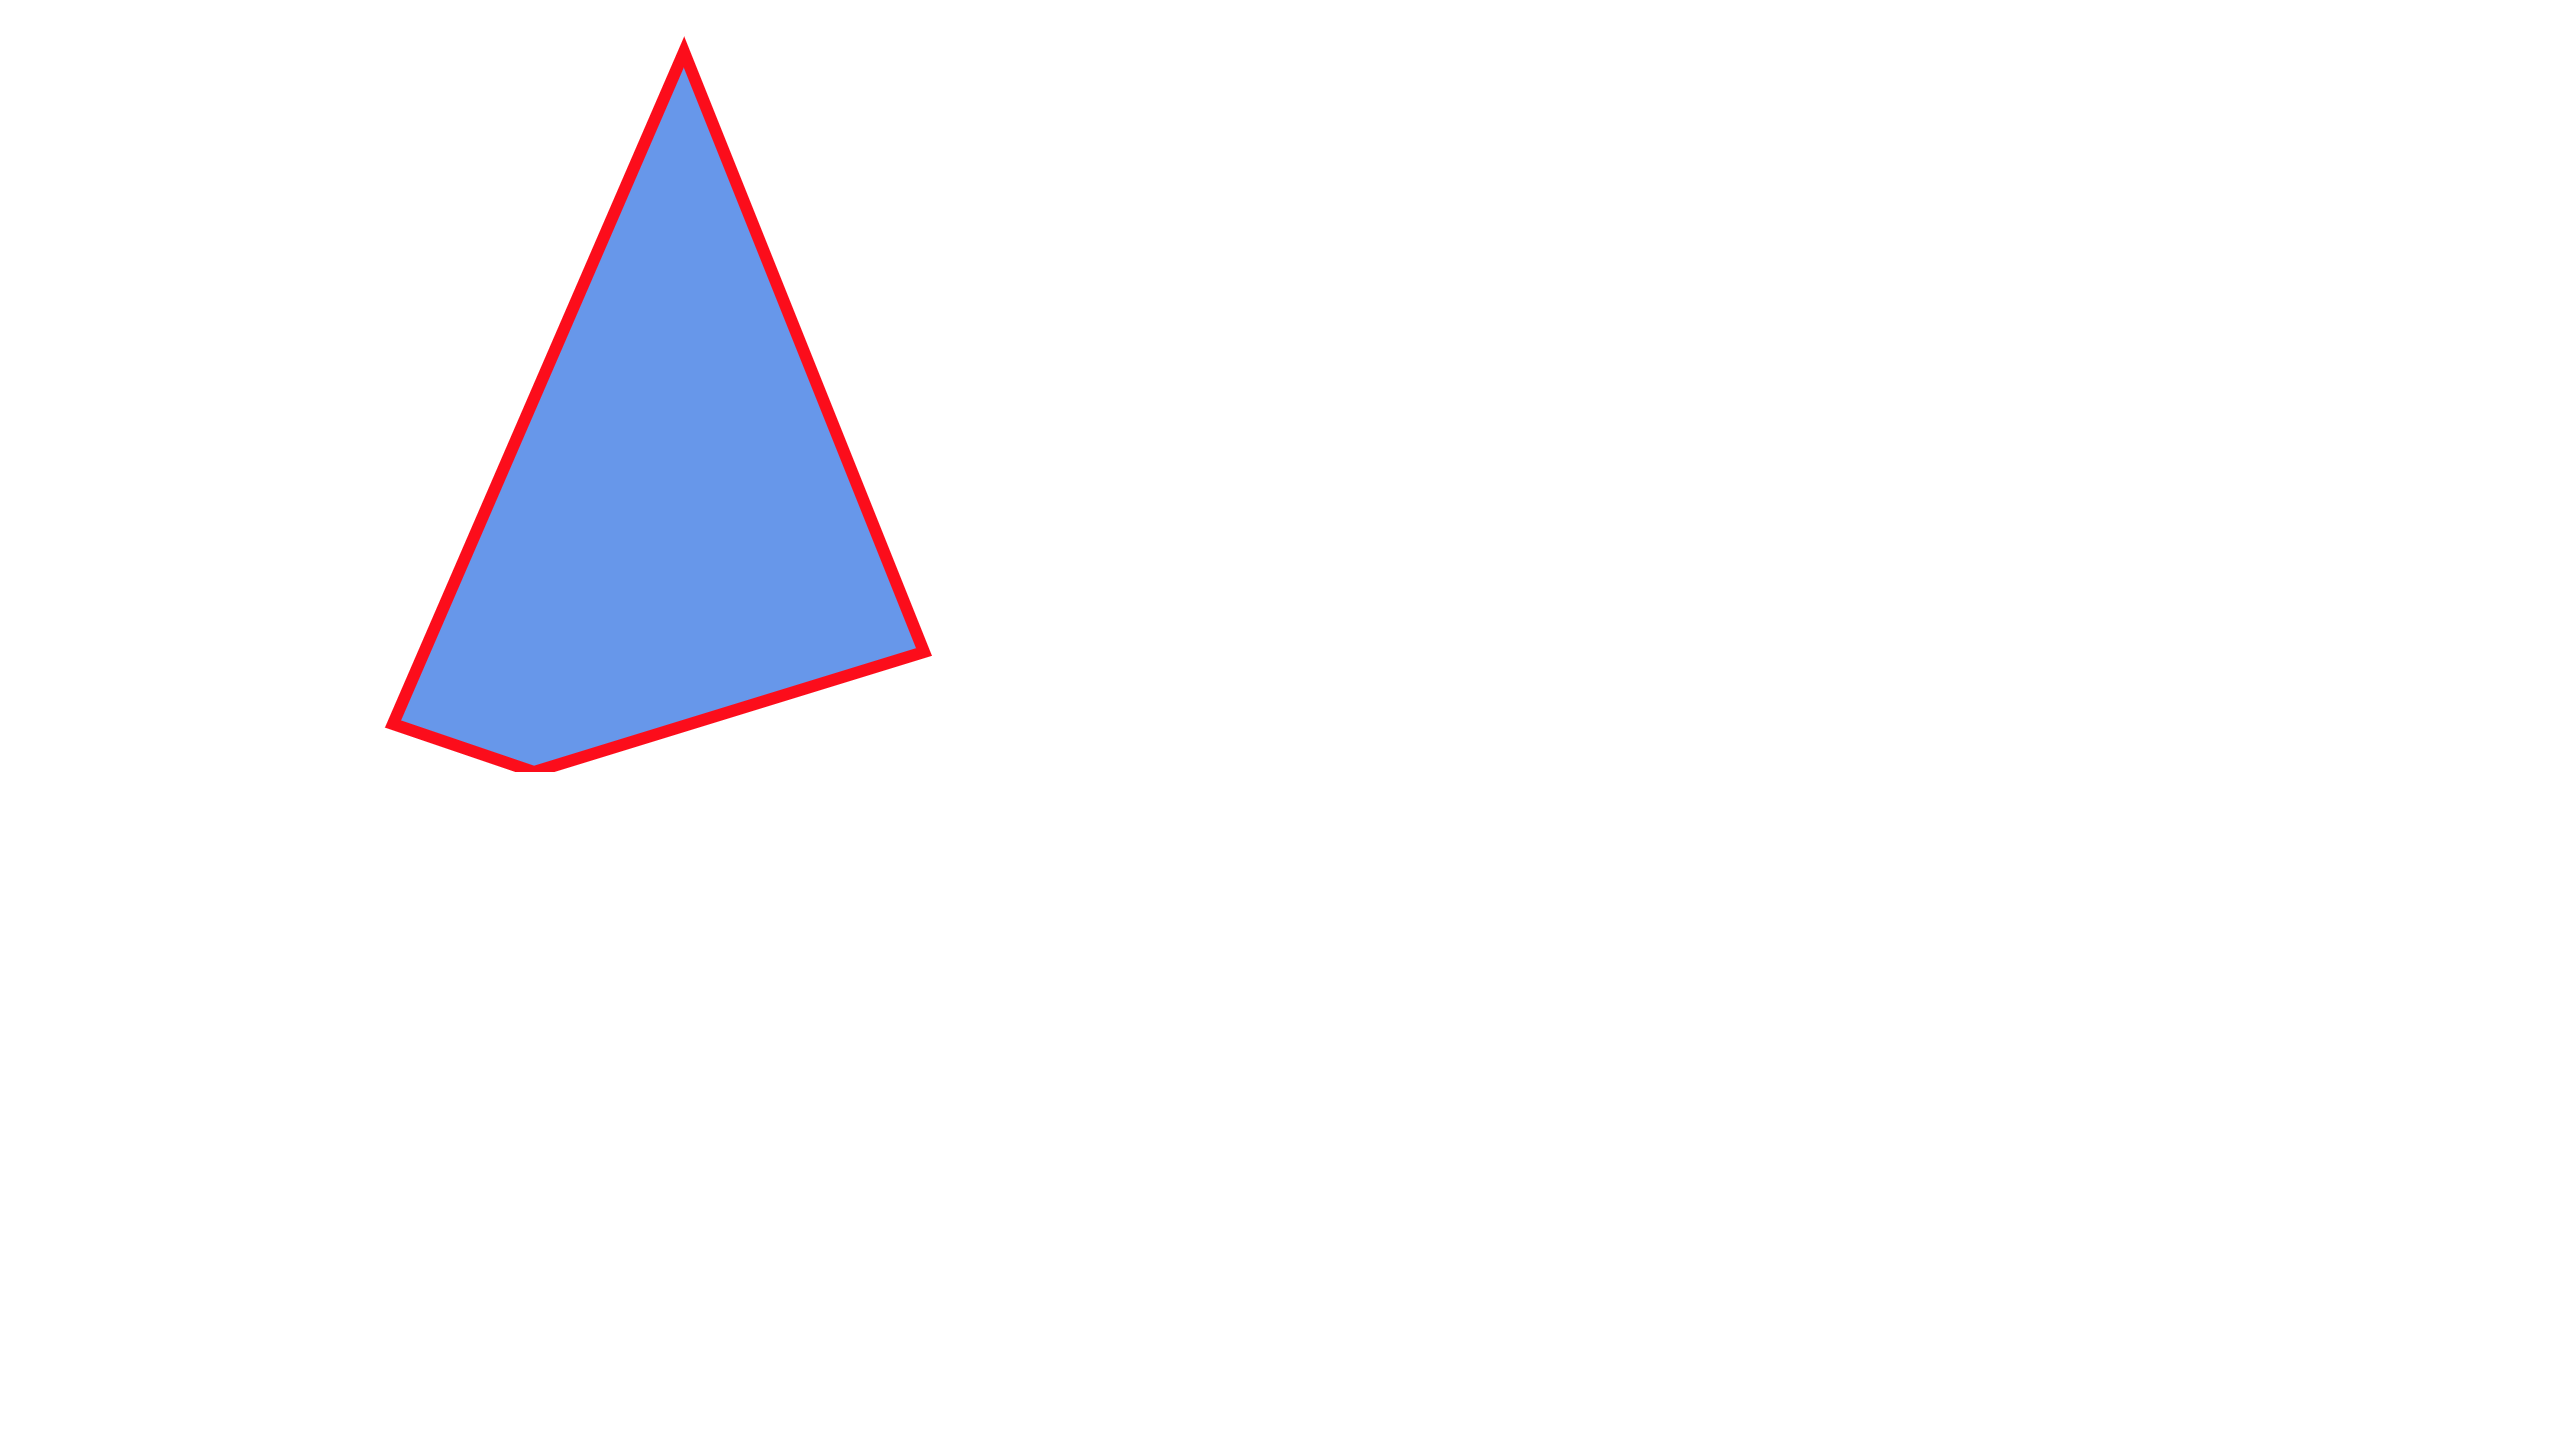
Code:
<svg height="250" width="500">
  <polygon
    points="220,10 300,210 170,250 123,234"
    style="fill: cornflowerblue; stroke: red; stroke-width: 4"
  />
</svg>
The <polygon> element from the aforementioned code was used inside the <svg> element. And we made use of the attributes of the point inside the polygon element.
The x and y coordinates of the polygon shape are specified by the point attribute.
By using the points attribute to set the x and y coordinates for each corner of the polygon, you can quickly create a star using the <polygon> element.
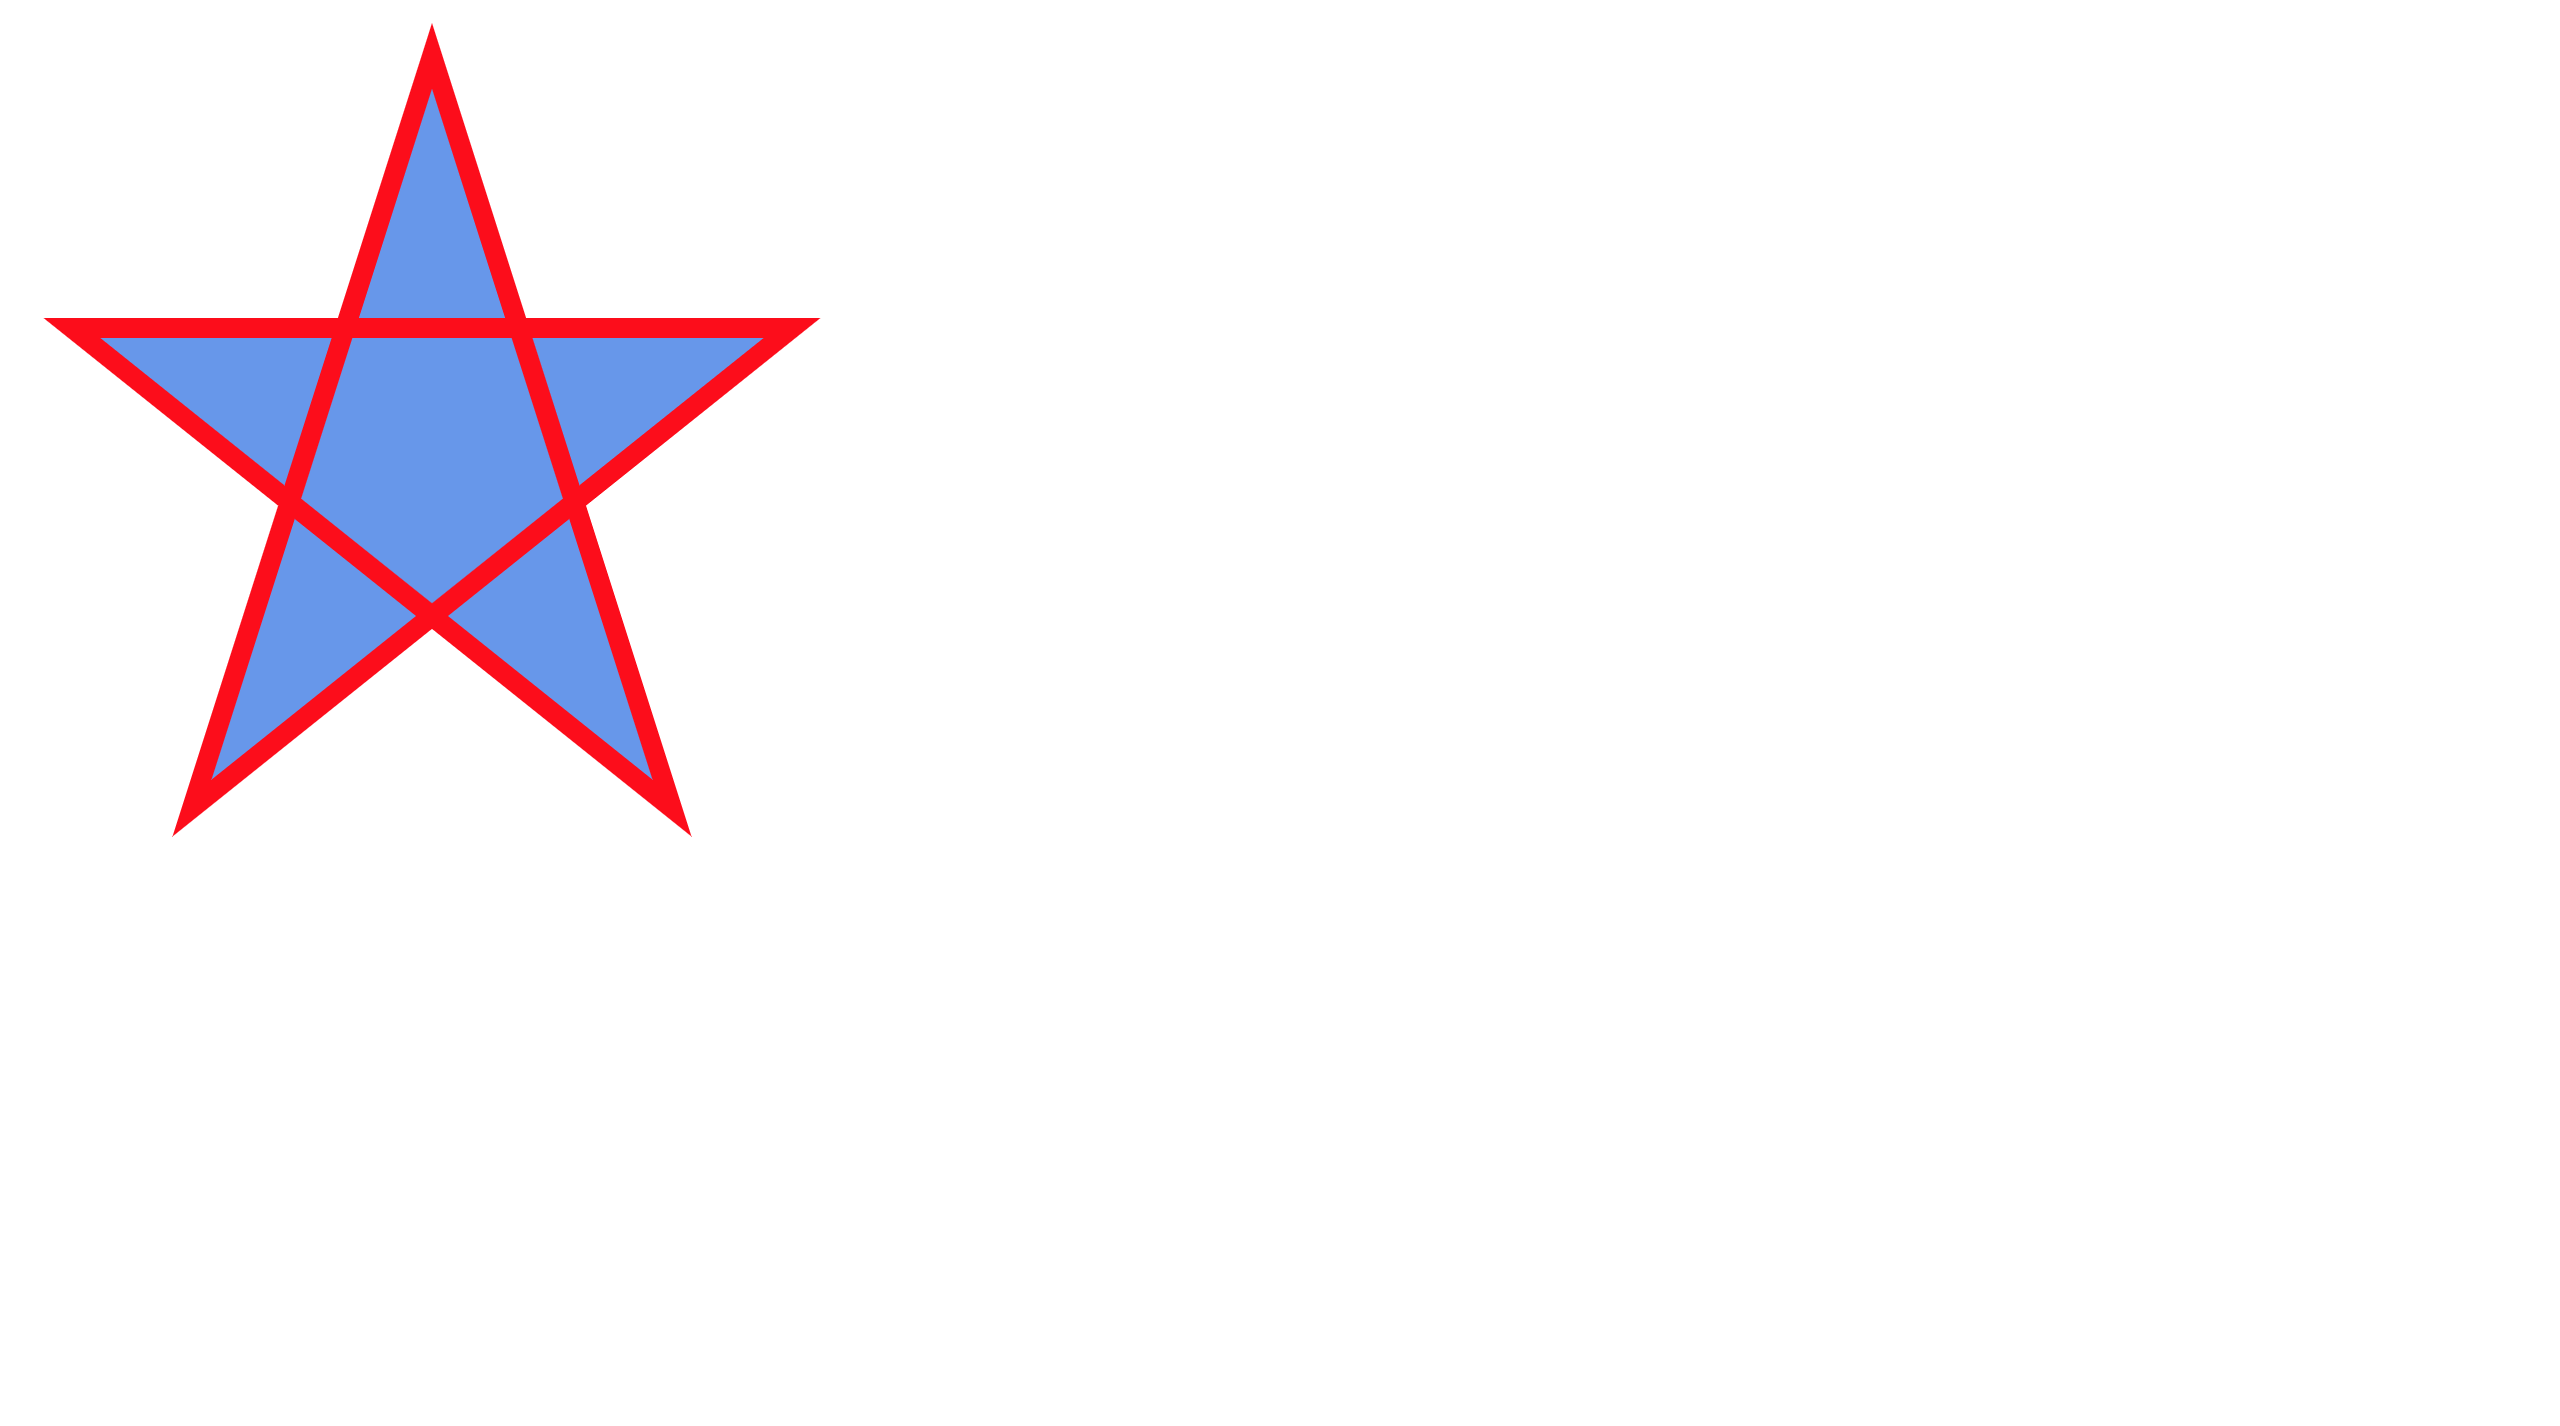
Code:
<svg height="210" width="500">
  <polygon
    points="100,10 40,198 190,78 10,78 160,198"
    style="
      fill: cornflowerblue;
      stroke: red;
      stroke-width: 5;
      fill-rule: nonzero;
    "
  />
</svg>
Text
You can easily write text using SVG; did you know that? It’s very simple to write a text, so let’s start by writing:
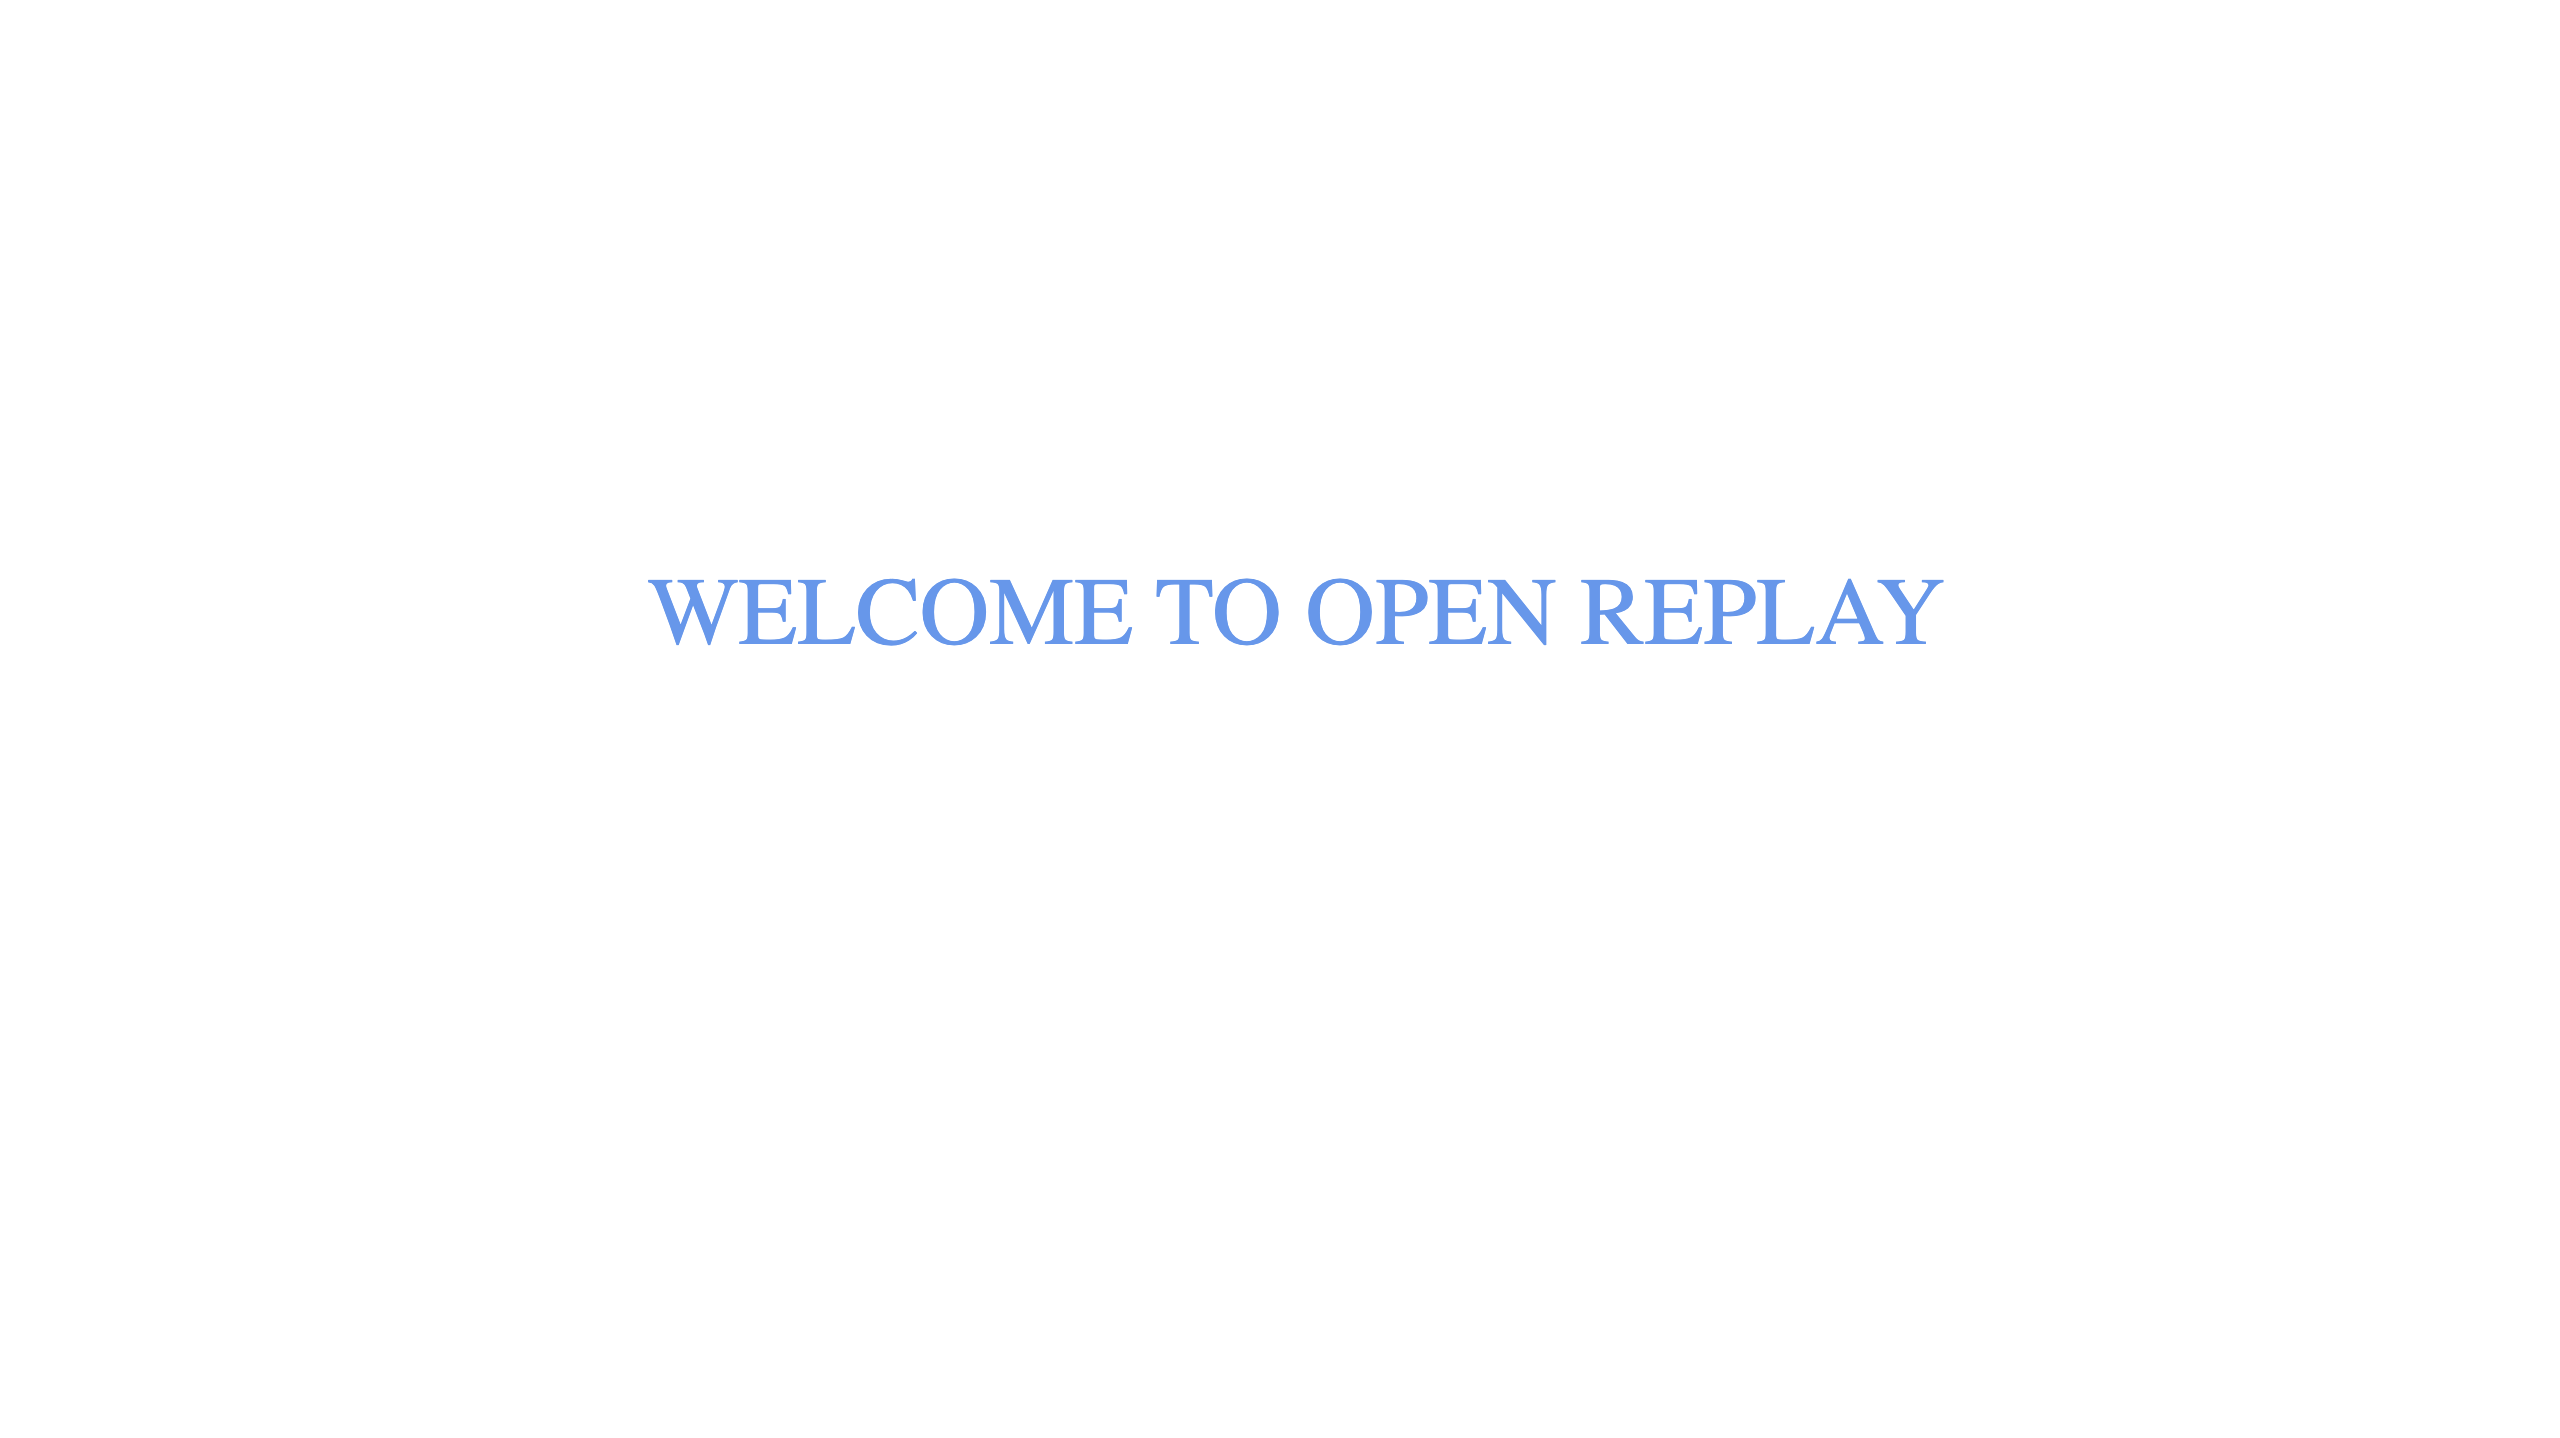
Code:
<svg width="">
  <text x="100" y="100" fill="cornflowerblue">WELCOME TO OPEN REPLAY</text>
</svg>
The text was positioned using the X and Y attributes from the code above, and we also used the fill attribute to give the text the color named cornflowerblue.
SVG Image
Finally, by including the SVG within an <img> element, it can be integrated into an HTML page. The URL of the SVG file should be in the src attribute of the <img> element:
<img src="/image.svg" width="500px" alt="" />Output:
By following the steps the procedures above, you can easily create an SVG in HTML. To get more SVG images, kindly click here.
How to create a shape with Canvas
An HTML canvas can be made in a fairly simple manner. The HTML5 canvas element must be present in your HTML file, along with the necessary attributes.
You must first declare your canvas element and specify its height and width. You can accomplish this by including an element with the proper attributes called <canvas> in your HTML document.
<canvas id="myCanvas" width="500" height="500"></canvas>The HTML document needs to contain some JavaScript code in order to make the canvas interactive once it has been added as an element. Use the canvas element’s getContext() method to accomplish this. You’ll have access to the canvas drawing API after doing this.
var canvas = document.getElementById("myCanvas"); var ctx =
canvas.getContext("2d");
You can begin drawing as soon as you have access to the canvas drawing API. You can draw shapes, lines, text, and gradients on the canvas using the drawing API’s methods. The fillStyle property also allows you to alter the color of the drawn shapes.
ctx.fillStyle = "#FF0000";
ctx.fillRect(20, 20, 150, 100);
Output:
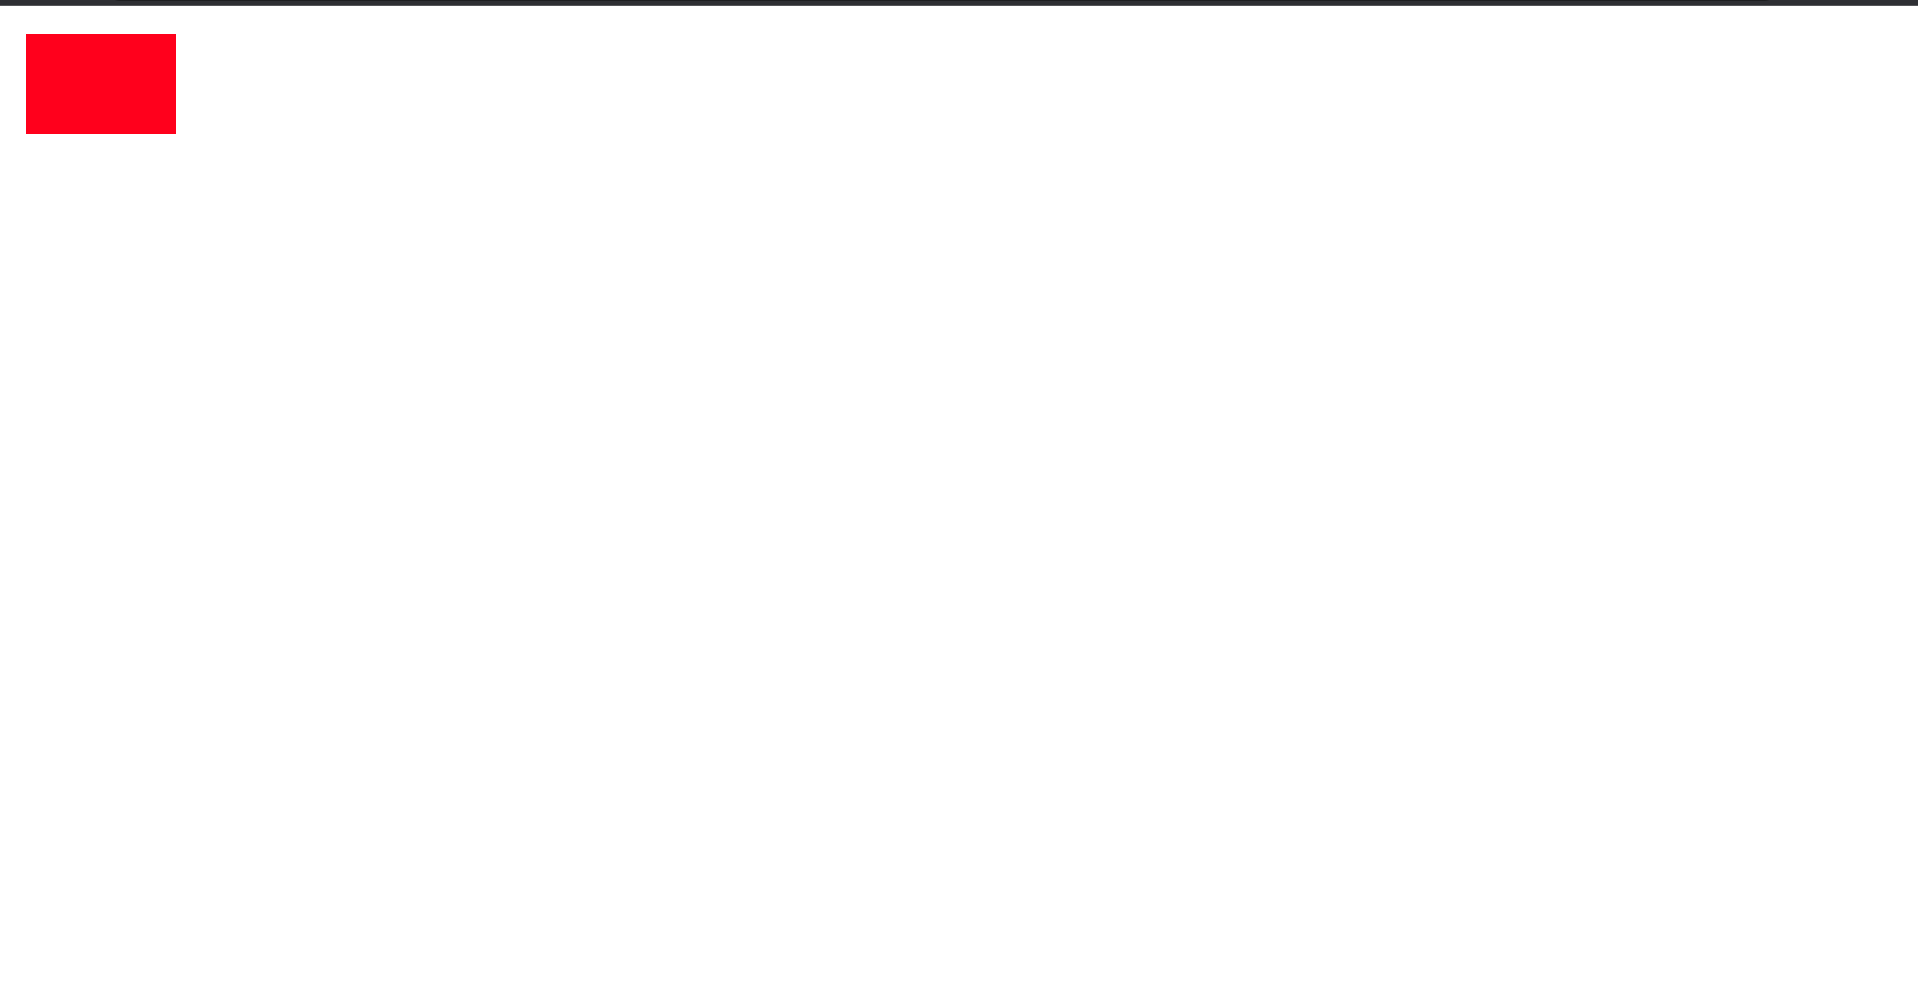
You can now begin developing your canvas-based projects because the canvas element is in place and the drawing API is enabled.
If you want to learn more about HTML canvas, visit MDN web docs.
Top 10 libraries that can help you create images on canvas
For people who don’t have a lot of experience with coding or graphic design, libraries can make it simpler to create and manipulate images on Canvas. It’s simple to get started using many libraries’ simple APIs. Below are the top 10 libraries that can help you to create images on Canvas:
- Fabric.js is a JavaScript library that provides a rich set of tools for creating and editing images on HTML5 canvas. It is simple to use and powerful, with support for a wide range of image components such as shapes, text, and patterns.
- Konva.js is a library that is specifically designed for creating high-performance, interactive 2D graphics within web browsers. It is able to handle multiple image formats and comes with a vast array of drawing tools and animations.
- D3.js is a well-known library for creating dynamic and interactive images on Canvas that is frequently used for data visualization. It can draw simple elements like axes and shapes as well as more intricate images.
- EaselJS is a JavaScript library that enables quick and easy image manipulation on HTML5 canvas. Shapes, text, and animations are among its variety of features.
- Paper.js is a vector graphics library capable of producing complex, interactive images on Canvas. It includes numerous tools for working with curves, paths, and shapes.
- Snap.svg is a JavaScript library for web-based SVG image manipulation. It’s simple to use and allows for simple vector graphics manipulation.
- Three.js is a 3D graphics library that creates stunning and highly interactive 3D images on canvas. It offers a wide range of tools for working with materials, textures, and lighting.
- Phaser is a framework for creating HTML5 games that use canvas. It provides a variety of image management tools, such as audio, animations, and physics engines.
- Chart.js is a popular library for creating dynamic and interactive canvas charts. It provides a variety of chart types, including bar, line, and pie charts.
- Create.js is a collective of JavaScript libraries used to create interactive graphics and animations with rich visual elements for websites.
Conclusion
I hope the comparison of SVG and Canvas was interesting. There is no clear winner in this competition because both SVG and Canvas have advantages and disadvantages, and the best option will depend on your programming background as well as the objectives and specifications of your project. If you’ve been using SVG to create simple graphics and want to try advanced graphics or build 2D games, you could consider giving Canvas a trial.
Gain Debugging Superpowers
Unleash the power of session replay to reproduce bugs and track user frustrations. Get complete visibility into your frontend with OpenReplay, the most advanced open-source session replay tool for developers.