Four top Front End Monitoring Tools for your Website
The best tools to enhance your website's performance


Are you looking for the best front-end monitoring tools? Wondering which tools might help reduce a chunk of your work by providing valuable data regarding your website’s performance, host metrics, error reports, etc.? Keep reading this post. This article takes a dig at front-end monitoring tools and how they might be beneficial for you.
What’s Front-end Monitoring?
Front-end or front-end application monitoring includes the process and tools for tracking and managing an application’s presentation layer. It also helps fix websites, native apps, and web apps by discarding potentially harmful errors. It gets easier to catch errors early, so debugging and modifying the code becomes more manageable.
Product owners, developers, and engineers use this application set. They use front-end monitoring to optimize the user experience. APM (application performance monitoring) is more about what end users see than the interaction between client and server. It’s essential to understand how the users interact with the application in terms of offering a positive experience.
How Front-end Monitoring Tools Can Level Up Website Performance
Front-end monitoring tools can level up your website’s performance by fixing Javascript errors, network request failure, issues related to a framework, performance issues, and user experience problems. That’s why the front-end monitoring tools are so necessary. Now, let’s discuss how front-end tools target and fix these errors.
JavaScript Issues
Several applications depend on JavaScript. Hence, finding out if there are any JavaScript errors is crucial regarding the goals of front-end monitoring. The types of JS issues involve syntax-based errors, DOM or Document Object Model errors, errors due to undefined methods, etc. While fixing the errors, you should also consider how often they occur and how critical they are.
Framework Related Errors
Some of the most popular front-end frameworks are Angular, KnockoutJS, Bootstrap, PatternFly, etc. Front-end application monitoring tools help detect problems regarding frameworks. For example, NGINX Amplify, a SaaS-based monitoring tool, monitors performance, tracks infrastructure assets, and enhances configuration using static analysis. Amplify is compatible with RHEL, Ubuntu, Fedora, Amazon Linux, and other open-source operating systems.
Network Request Failure
Web apps and websites can be integrated with many external services. It makes them perform additional functions, and thus they can send HTTP requests to their host servers. Monitoring tools track those HTTP requests and replies initiated by the user to find errors.
User Experience Related Issues
The front-end monitoring tools can track if any user clicks on any element quickly multiple times (rage clicks). They can also ensure the elements are correctly rendered and identified when any user can’t move out of a particular navigation loop. Therefore, when building a front-end application, you must ensure your customers don’t face any user experience issues. Make your customers’ interests a priority to get their loyalty towards your products.
Open Source Session Replay
OpenReplay is an open-source, session replay suite that lets you see what users do on your web app, helping you troubleshoot issues faster. OpenReplay is self-hosted for full control over your data.
Start enjoying your debugging experience - start using OpenReplay for free.
The tools
Let’s take a quick look at the best front-end monitoring tools to track errors, fix crashes, monitor performance, etc.
Sentry
Sentry is one of the best and the most used front-end application monitoring tools. It offers tools to identify and fix bugs and other usability-related problems. Sentry provides easy installation, transaction tracing, and Google’s Web vitals for performance details. Sentry has a free, open-source version that acts similarly to its paid version. Sentry notifies you whenever it finds your application will crack or slow down. Then you need to address the issue that might have caused the error.
Sentry’s Performance overview gives you information about how many transactions are triggered, the time required, the Apdex score, etc. Though Sentry supports server-side programming languages, it doesn’t have server-specific logs integration.
Site24x7
Next is, Site24x7. Site24x7 provides a view of your project or application’s performance in the real world. This is mainly used in monitoring Availability and User Experience. Some of the amazing features of Site24x7 are cloud management, server monitoring, real user monitoring, and so on. On Site24x7’s Web section, you monitor your website or APIs. With REST API, it helps track SLA compliance. This gives users’ availability, response times, history of breakdowns, and details on throughput.
Also, Site24x7 monitors SSL and TLS certificates, domain expiration, etc. The RUM tool helps track users’ locations and browsers used by them. The cloud-based log management provides a centralized location. This gives you troubleshooting infrastructure-related insights on timeouts, exceptions, delays, and several other errors.
AppSignal
AppSignal is an exciting combination of 5 different types of monitoring. The varieties include error tracking, performance monitoring, server monitoring, metrics dashboards, and anomaly detection. AppSignal supports a wide range of Frameworks and programming languages, including Node.js, JavaScript, Ruby, and Elixir. It’s pretty simple to use, and the installation takes only 5 minutes or less. Once installed, AppSignal builds an intuitive dashboard for getting notifications and performance incidents.
AppSignal’s agent has been developed with Rust. Rust is stable, lightweight, and provides support to many applications. And it guarantees 99.999% uptime while monitoring the system. Apart from that, AppSignal is GDPR compliant.
OpenReplay
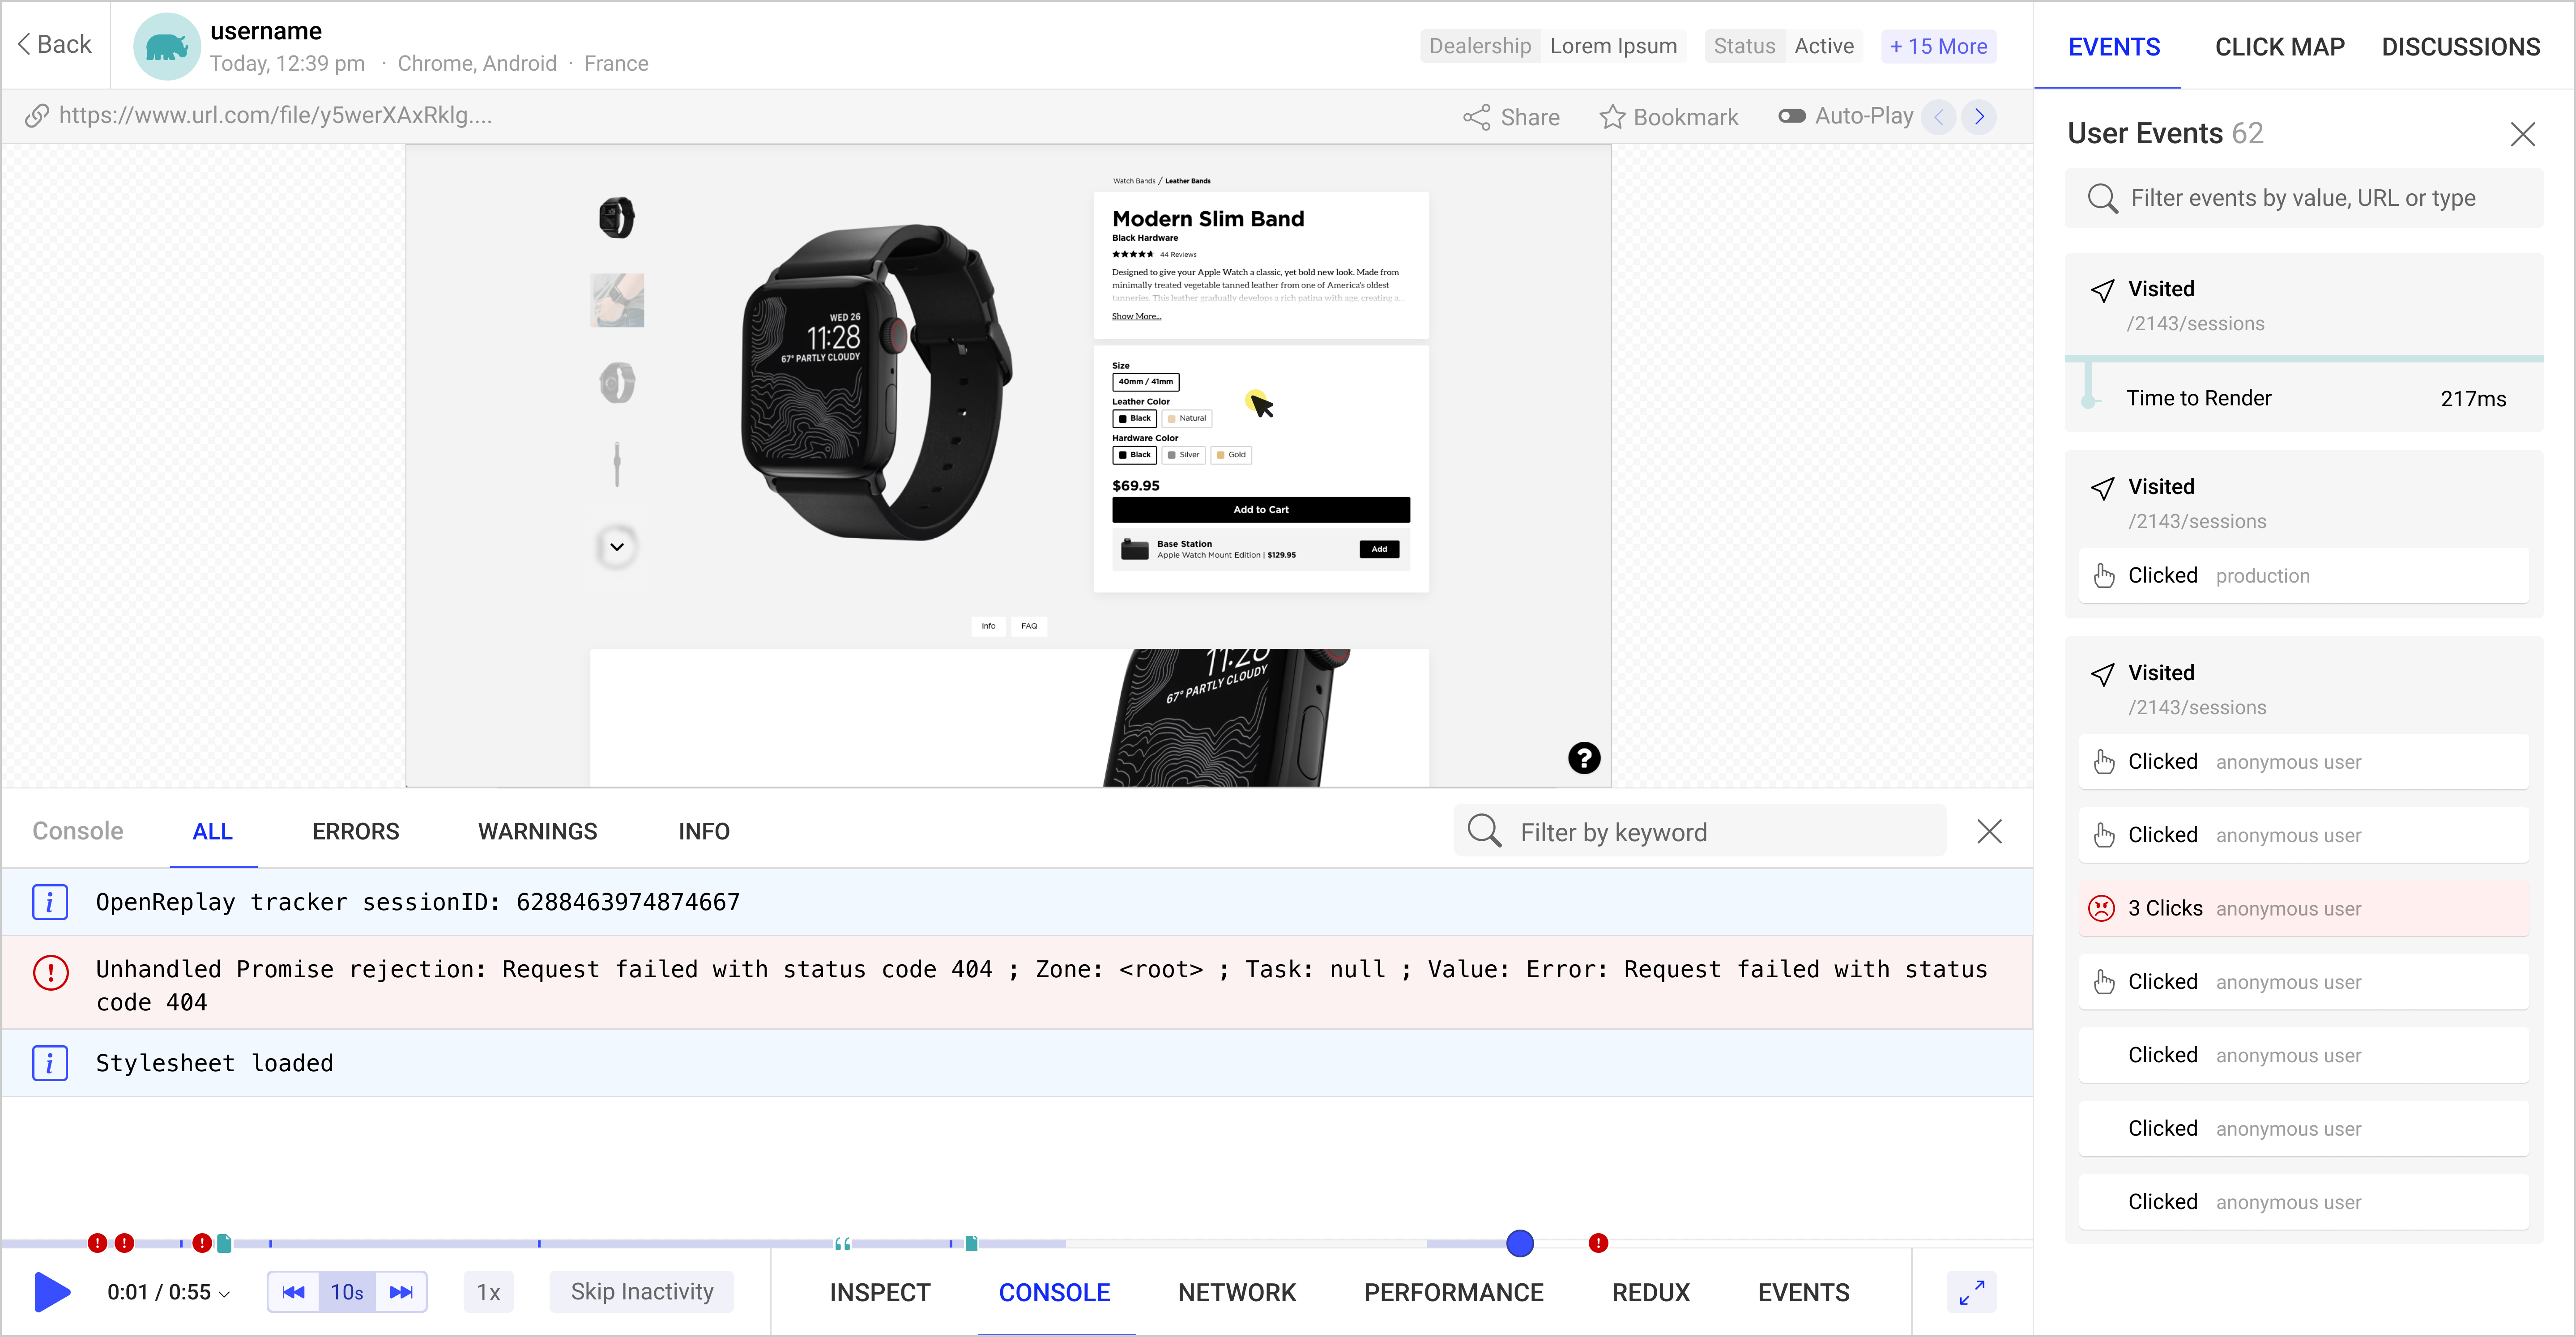
And finally, OpenReplay. OpenReplay is an open source front-end monitoring tool that offers a nice set of features just like the above three. OpenReplay’s tools offer network activity inspection, performance monitoring, state monitoring, error tracking, error management, and turbocharging your stack. It detects problematic calls by inspecting responses and requests. Also, OpenReplay tracks critical slowdowns, crashes, CPU/memory usage, rendering times, etc. It digs within the state of your application to understand the root cause of the issues.
It can capture JavaScript errors and sync with recordings. You can upload your source maps to see the source code in the stack trace and plug in your tools to sync errors and events on your stack. Check OpenReplay docs for further details.
Bottomline
Creating an application requires lots of resources and creativity, and damaging its performance due to non-maintenance would be the last thing you’d want. So, use front-end application monitoring tools to keep your apps healthy. And that’s a wrap. I hope you find this article useful while choosing the best front-end monitoring tool.
A TIP FROM THE EDITOR: For a global (and quite practical) point of view about monitoring, don’t miss our Rethinking Frontend Monitoring article.