Optimizing Web Experience with Interaction to Next Paint (INP)

Interaction to Next Paint (INP) is a great way to optimize your website’s Core Web Vitals. It allows you to directly improve your website’s SEO performance, leading to higher search engine rankings and increased organic traffic. This article explains INP and how you can optimize your site for a faster, more responsive experience that keeps users engaged.

Discover how at OpenReplay.com.
Many websites struggle with laggy performance, which leads to a frustrating user experience. A very common instance is clicking a button and encountering a noticeable delay before anything happens. This lack of responsiveness can cause users to abandon your site altogether. This is where Interaction to Next Paint (INP) comes in, a metric introduced by Google on March 12, 2024, to replace First Input Delay (FID) as a Core Web Vital metric.
As a developer, you can identify and address these web performance issues by focusing on INP optimization. This article will give insight into what INP means and how to optimize your website by reducing your INP score.
What is Interaction to Next Paint (INP)?
INP is a metric that measures how well a website performs. It focuses on user interactions, particularly the website’s overall responsiveness. This refers to how quickly the website responds to all the user’s qualifiable interactions throughout their session, such as clicks, taps, or keyboard interactions.
In simpler terms, INP measures the time elapsed, known as latency, from when a user interacts with your website via a click or keypress until the user sees a visual display on the webpage confirming that the interaction was successful.
Interaction latency, the slight delay between an action on your webpage and the visual response, is a combination of three factors: Input Delay (time for the browser to recognize the action, like a click, and trigger the code), Processing Time (how long the browser spends running the associated code), and Presentation Delay (the final wait before the browser updates the screen to reflect the completed action).
Why is INP Important for Web Experience?
It’s important to note that some interactions might take longer than others. However, when it comes to complex interactions, it’s vital to quickly display some initial visual feedback to inform your users that something is happening.
Website responsiveness is at the heart of a great user experience, and that’s what SEO (Search engine optimization) is all about. INP exceeds simple load times to measure how quickly your page reacts to user interactions. Pages that feel snappy and responsive are more engaging, leading to lower bounce rates and potentially higher search rankings.
To get a clearer picture of how INP is important for web experience, look at the following example:
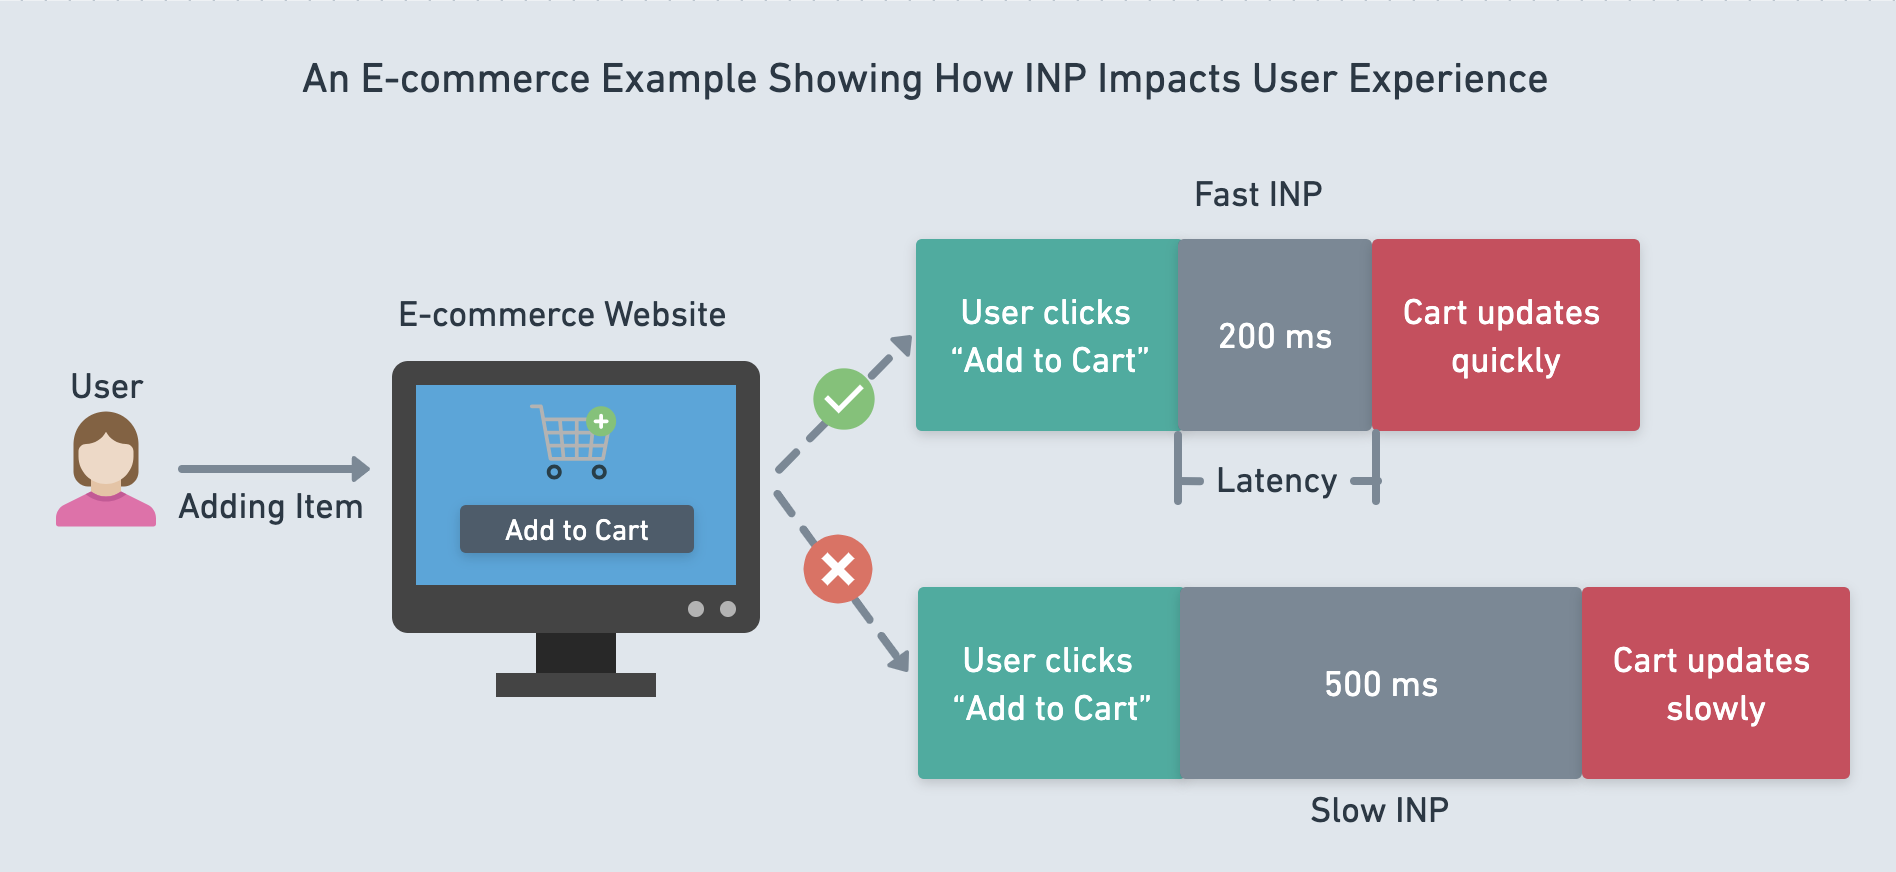
Let’s say you’ve built an e-commerce store, and users visit your website. Whenever one of your customers tries to purchase an item by adding it to their cart, they need to see a visual display confirming that the item has been added to their cart or that something is happening.
The time it takes them to receive visual feedback that something is happening, even before they receive confirmation that their item has been added to their cart, plays a huge part. If it takes too long, your user will not be satisfied with the web experience.
This is where INP comes in, allowing you to measure that latency, when your users start an interaction until the next visual update is rendered.
How is INP Measured?
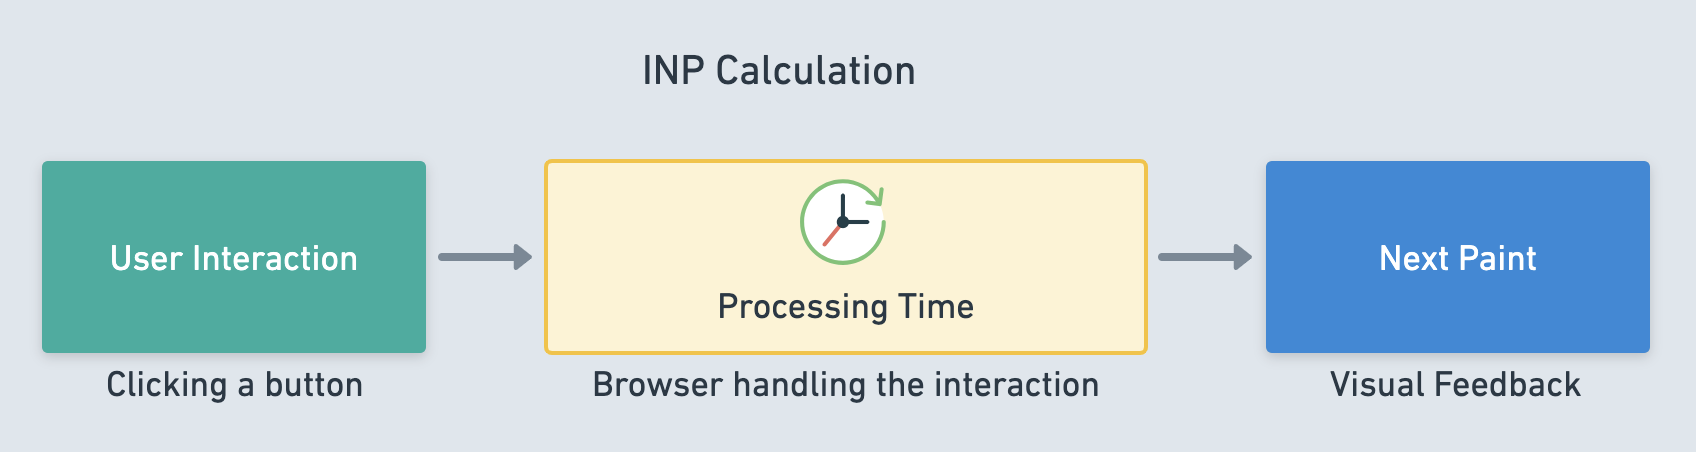
INP is measured by monitoring all the interactions a user triggers on a webpage. To understand how INP is calculated, look at the illustration below:
The following steps are involved in the process:
-
User Interaction: First, your users start an interaction on your webpage by clicking a link or typing a form field.
-
Browser Input Detection: The web browser detects the user input (click, keypress, etc.) and starts a timer to track the time it takes to display the next visual change.
-
Event Handling: The browser processes any JavaScript event handlers associated with that specific interaction. This might involve tasks like form validation or data fetching.
-
Painting: Once processing is complete, the browser updates the webpage layout and displays the visual feedback for the user’s action, and then the timer stops.
-
INP Calculation: This process occurs continuously throughout the user’s entire session on the webpage. INP is calculated as the longest duration recorded between a user interaction and the corresponding visual update, known as the “Next Paint”.
It’s important to note that how INP is calculated changes depending on the number of interactions on a webpage. For pages with fewer interactions (under 50), the INP score is the single slowest interaction time recorded throughout the user’s visit. This ensures that even if only one interaction is slow, it will still be counted towards the INP score.
For example, assume your webpage has only a few buttons or links. If one of those buttons takes a very long time to respond when clicked (sluggish response), you want to ensure that slowness is reflected in the INP score. Using the single slowest interaction time, even a sluggish reaction from that one button will significantly impact the INP. This ensures that even a rare performance issue gets captured.
While for pages with many interactions (over 50), INP focuses on the user’s overall experience by considering the 98th percentile of the slowest interaction times. This means the occasional slow response won’t significantly affect the INP score, providing a more accurate picture of the website’s general responsiveness.
What is a Good INP Score?
INP is measured in milliseconds (ms), and a lower score means a faster and more responsive user experience. To ensure that your website has a great user experience and good responsiveness, you need to be able to interpret INP scores.
Look at the following illustration showing INP scores:
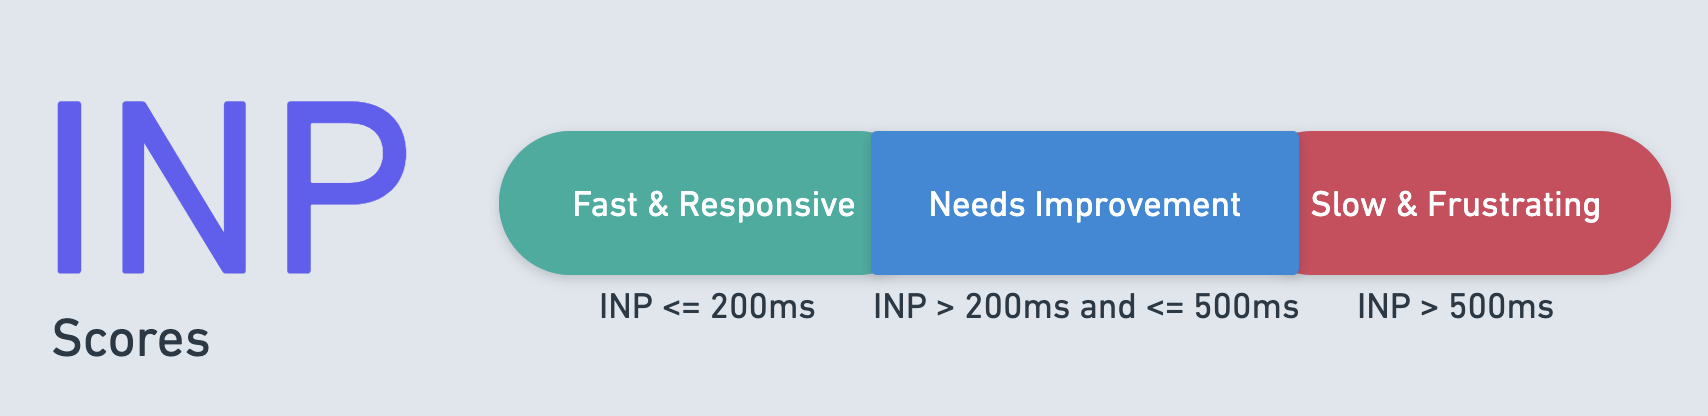
Here’s a general guideline recommended by Google that you can use:
-
Good (INP under 200ms): If your INP score is less than or equal to 200 milliseconds, your web page has good responsiveness. This means your users will get a very responsive experience on your webpage, with minimal delay between their actions and the corresponding visual update.
-
Needs Improvement (INP between 200ms and 500ms): An INP score between 200 and 500 milliseconds indicates that your web page’s responsiveness requires improvement. This means users may experience noticeable delays between their actions and visual updates.
-
Poor (INP over 500 ms): If your web page’s INP score is greater than 500 milliseconds, it has poor responsiveness. Users will find the page unresponsive and frustrating and experience significant delays after interaction.
From this list, you can see that if you want optimal page responsiveness and user experience, you should strive for a score below 200 ms.
Tools for Measuring INP
You can use several tools to measure INP, using two key approaches: field and lab methods. The Field method collects real-world data from user interactions on your website, while the Lab method simulates user interactions in a controlled environment.
It is ideal to combine both methods since Field data provides real-world insights, while Lab methods help you isolate and fix specific performance issues. Let’s look at some tools you can use to measure INP.
PageSpeed Insights
PageSpeed Insights is a tool that displays the INP metric for both mobile and desktop devices, indicating the time it takes your page to respond to user interactions in milliseconds. It provides both lab and field data about a page. Also, it gets and uses real user data from CruX Report (Chrome User Experience) to give you a 28-day performance report for your webpage and its overall site.
To determine your website’s INP, go to PageSpeed Insights, then enter the URL of the webpage in the field provided and click “Analyze” as shown below:
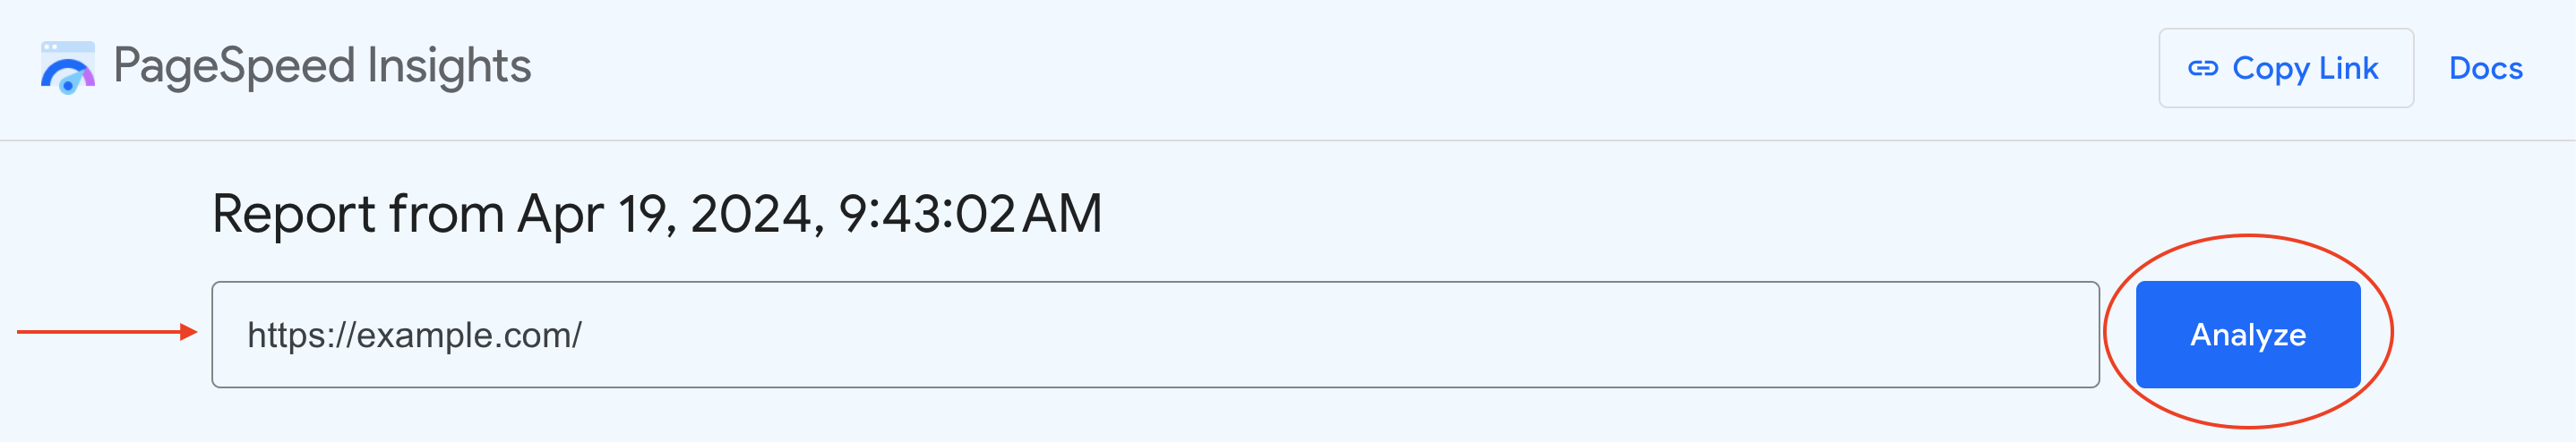
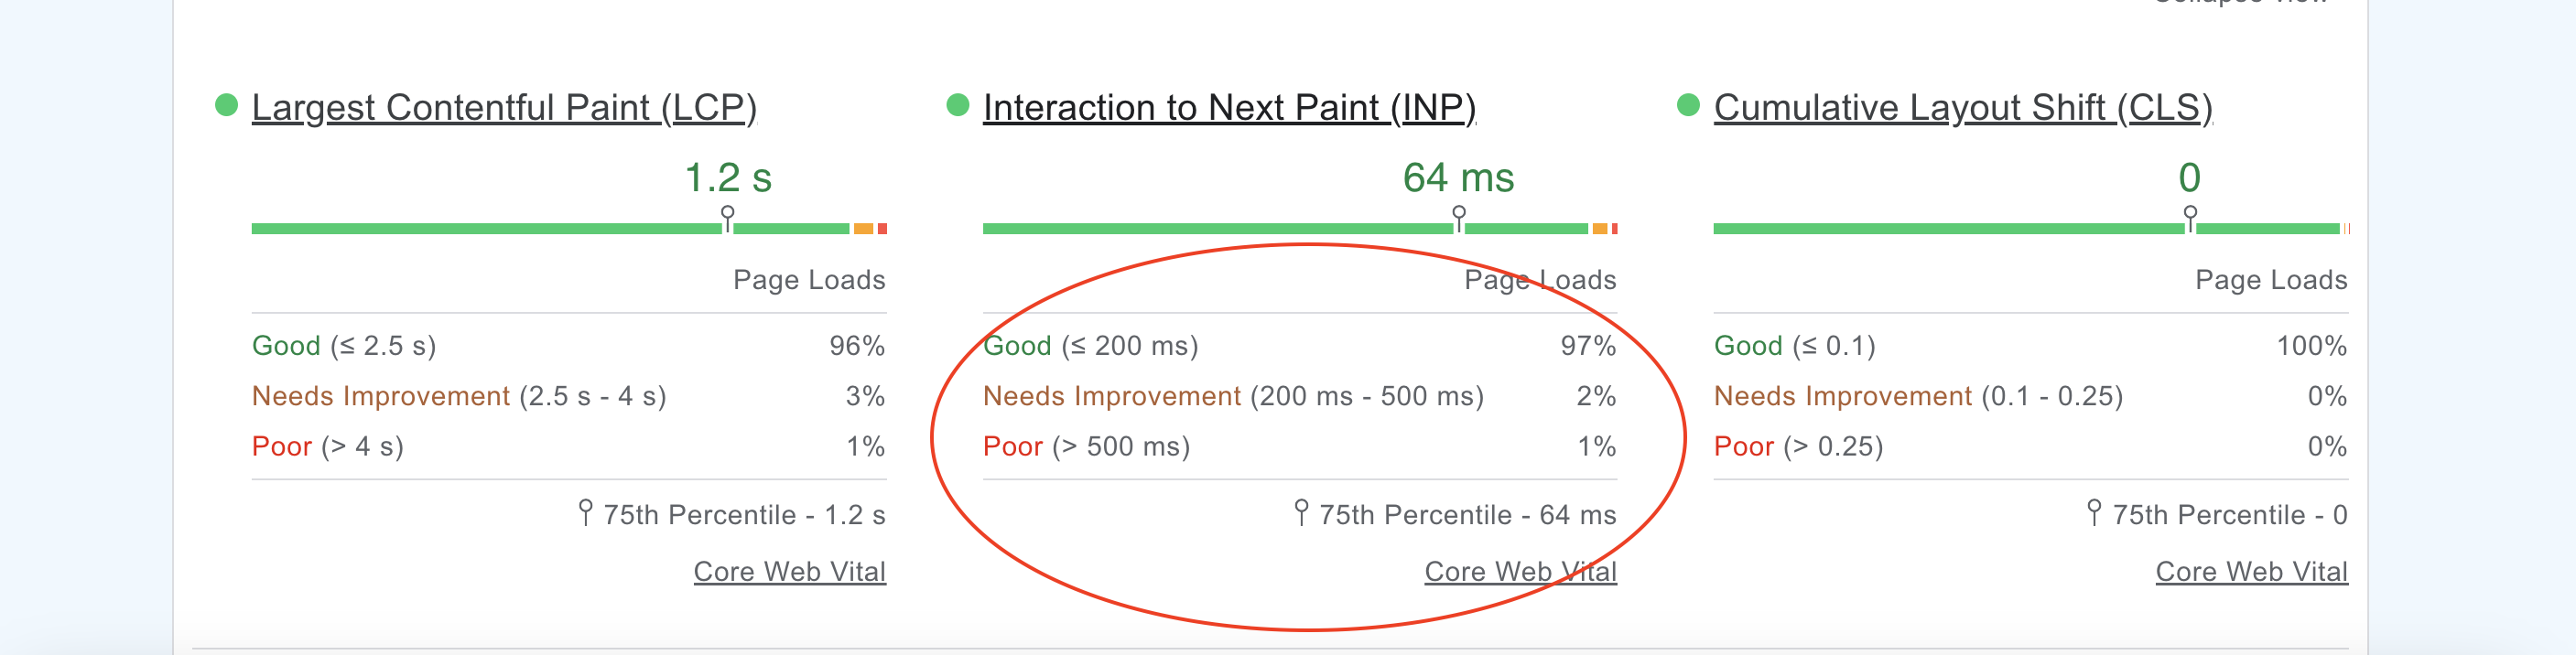
The tool will begin to analyze your webpage and generate a report, which will show your INP score as follows:

The INP metric reports the 75th percentile of user experiences. As shown in the screenshot above, the INP score is 64ms, indicating that 75% of your visitors experienced a delay of less than 64ms between their interaction and the next visual update on the webpage. The remaining 25% of visitors might have encountered slightly slower response times, but even the slowest interaction for this group was likely under 64ms.
Additionally, you can click on the “Expand view” button at the top-right corner to see the report’s details and identify the top issues that are lowering your page’s INP.
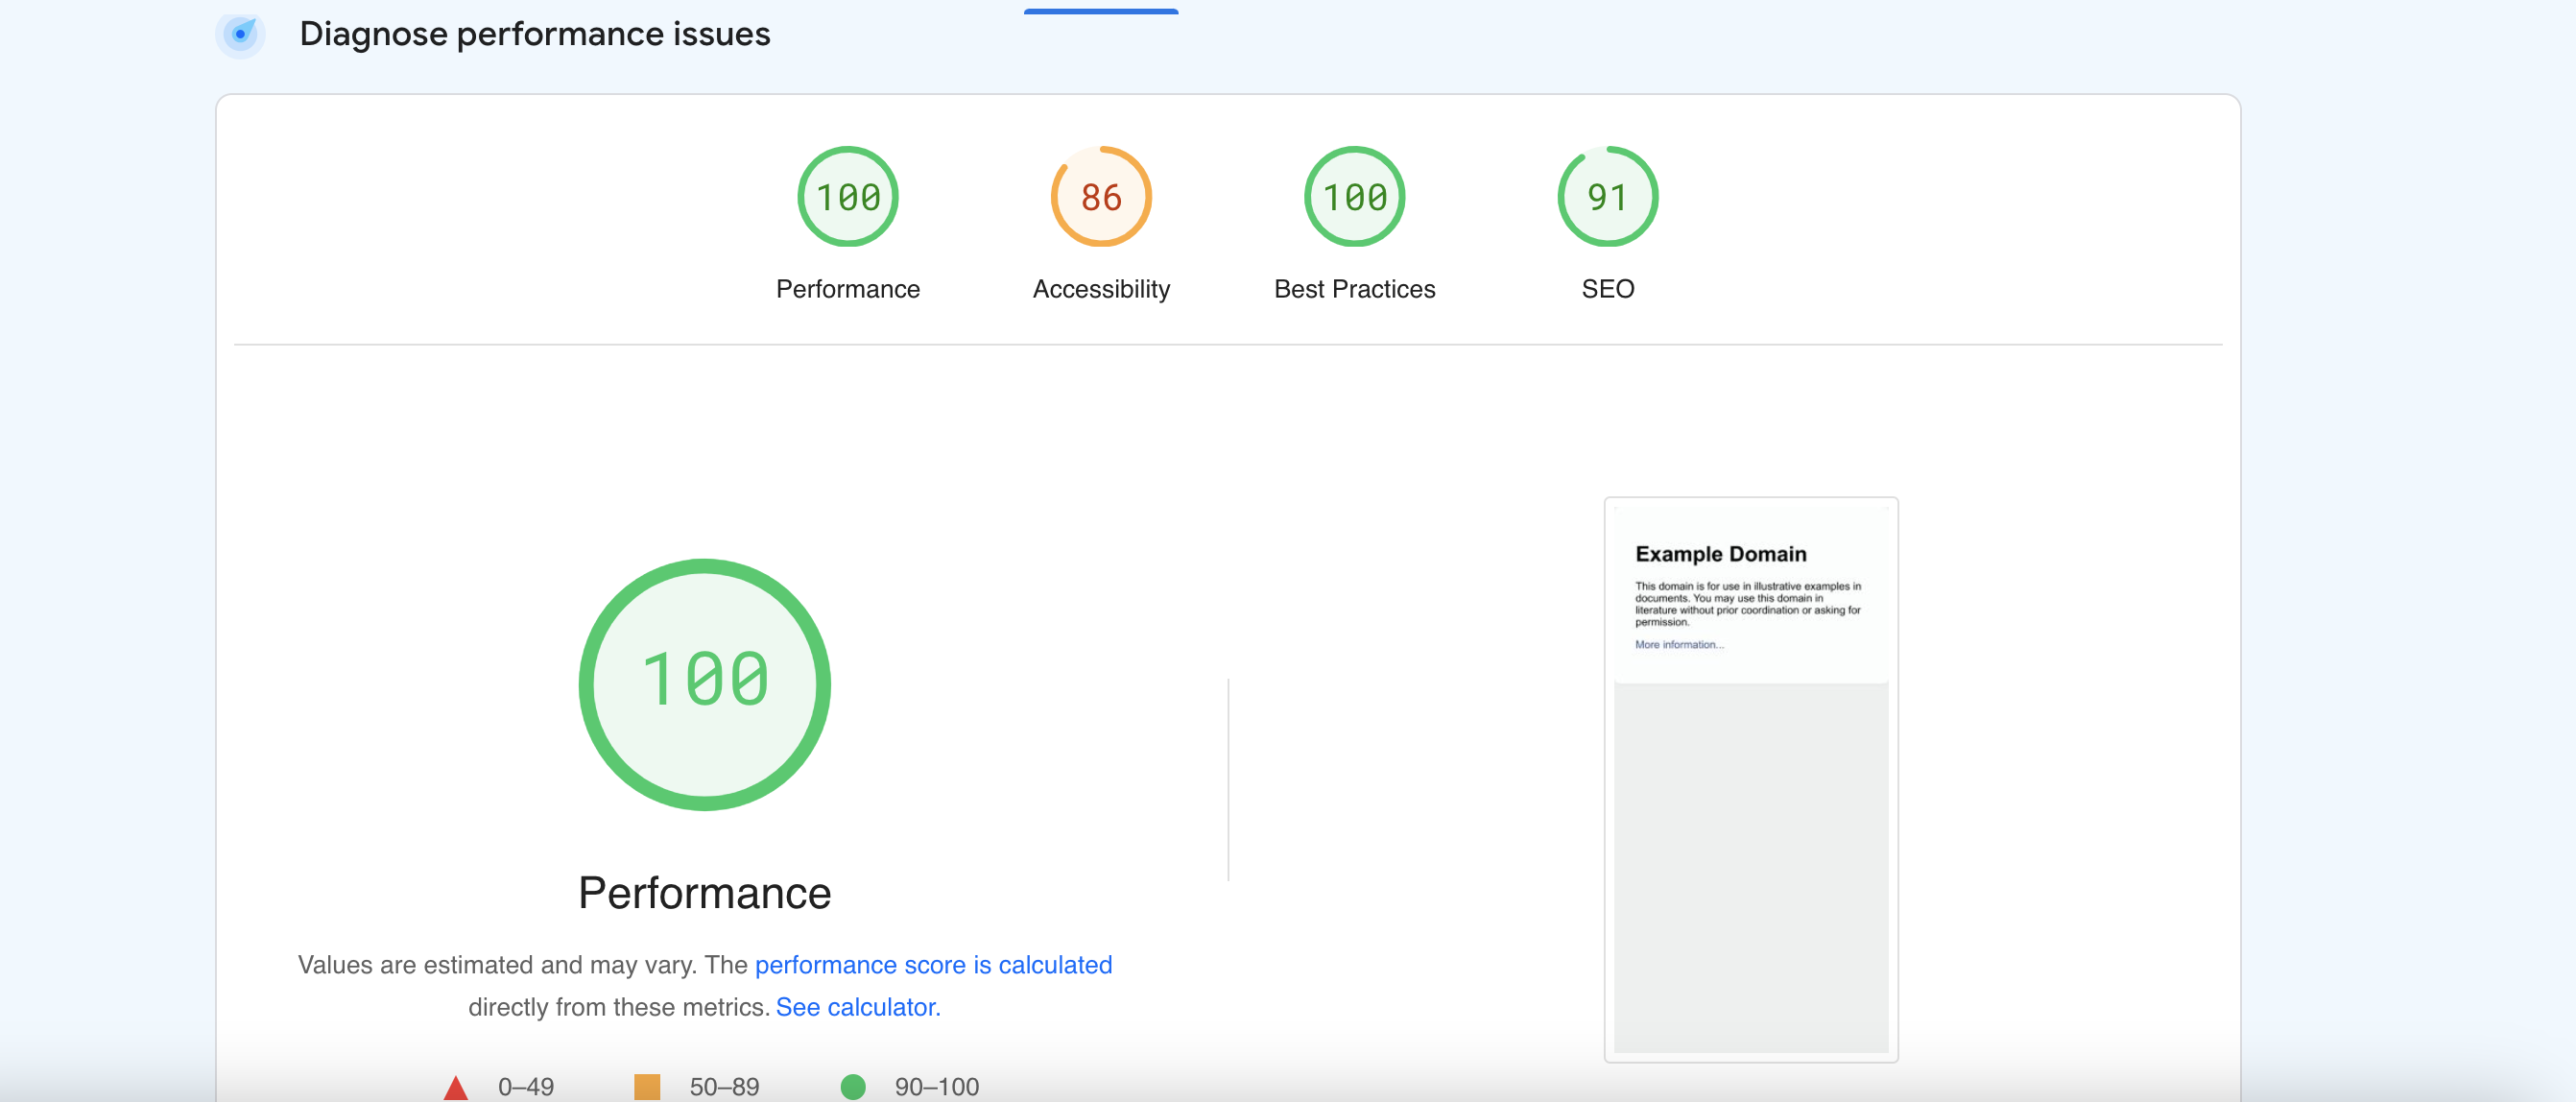
To gain further insights into the report, you can scroll down to the “Diagnose performance issues” section and access all the information you need to identify the problems and make changes to improve performance:
INP Debugger
The INP Debugger is a free tool that helps identify slow interactions on your website. Like the previous one, you will be required to enter your URL to use this tool. It will automatically find clickable elements, simulate user actions, and highlight any slow responses. This will help you pinpoint which parts of your website might be causing sluggish performance.
While the INP debugger identifies slow interactions, it can’t tell how often users click on those elements. You’ll have to set up real user monitoring (RUM) on your website to understand real user behavior and their most frequent interactions.
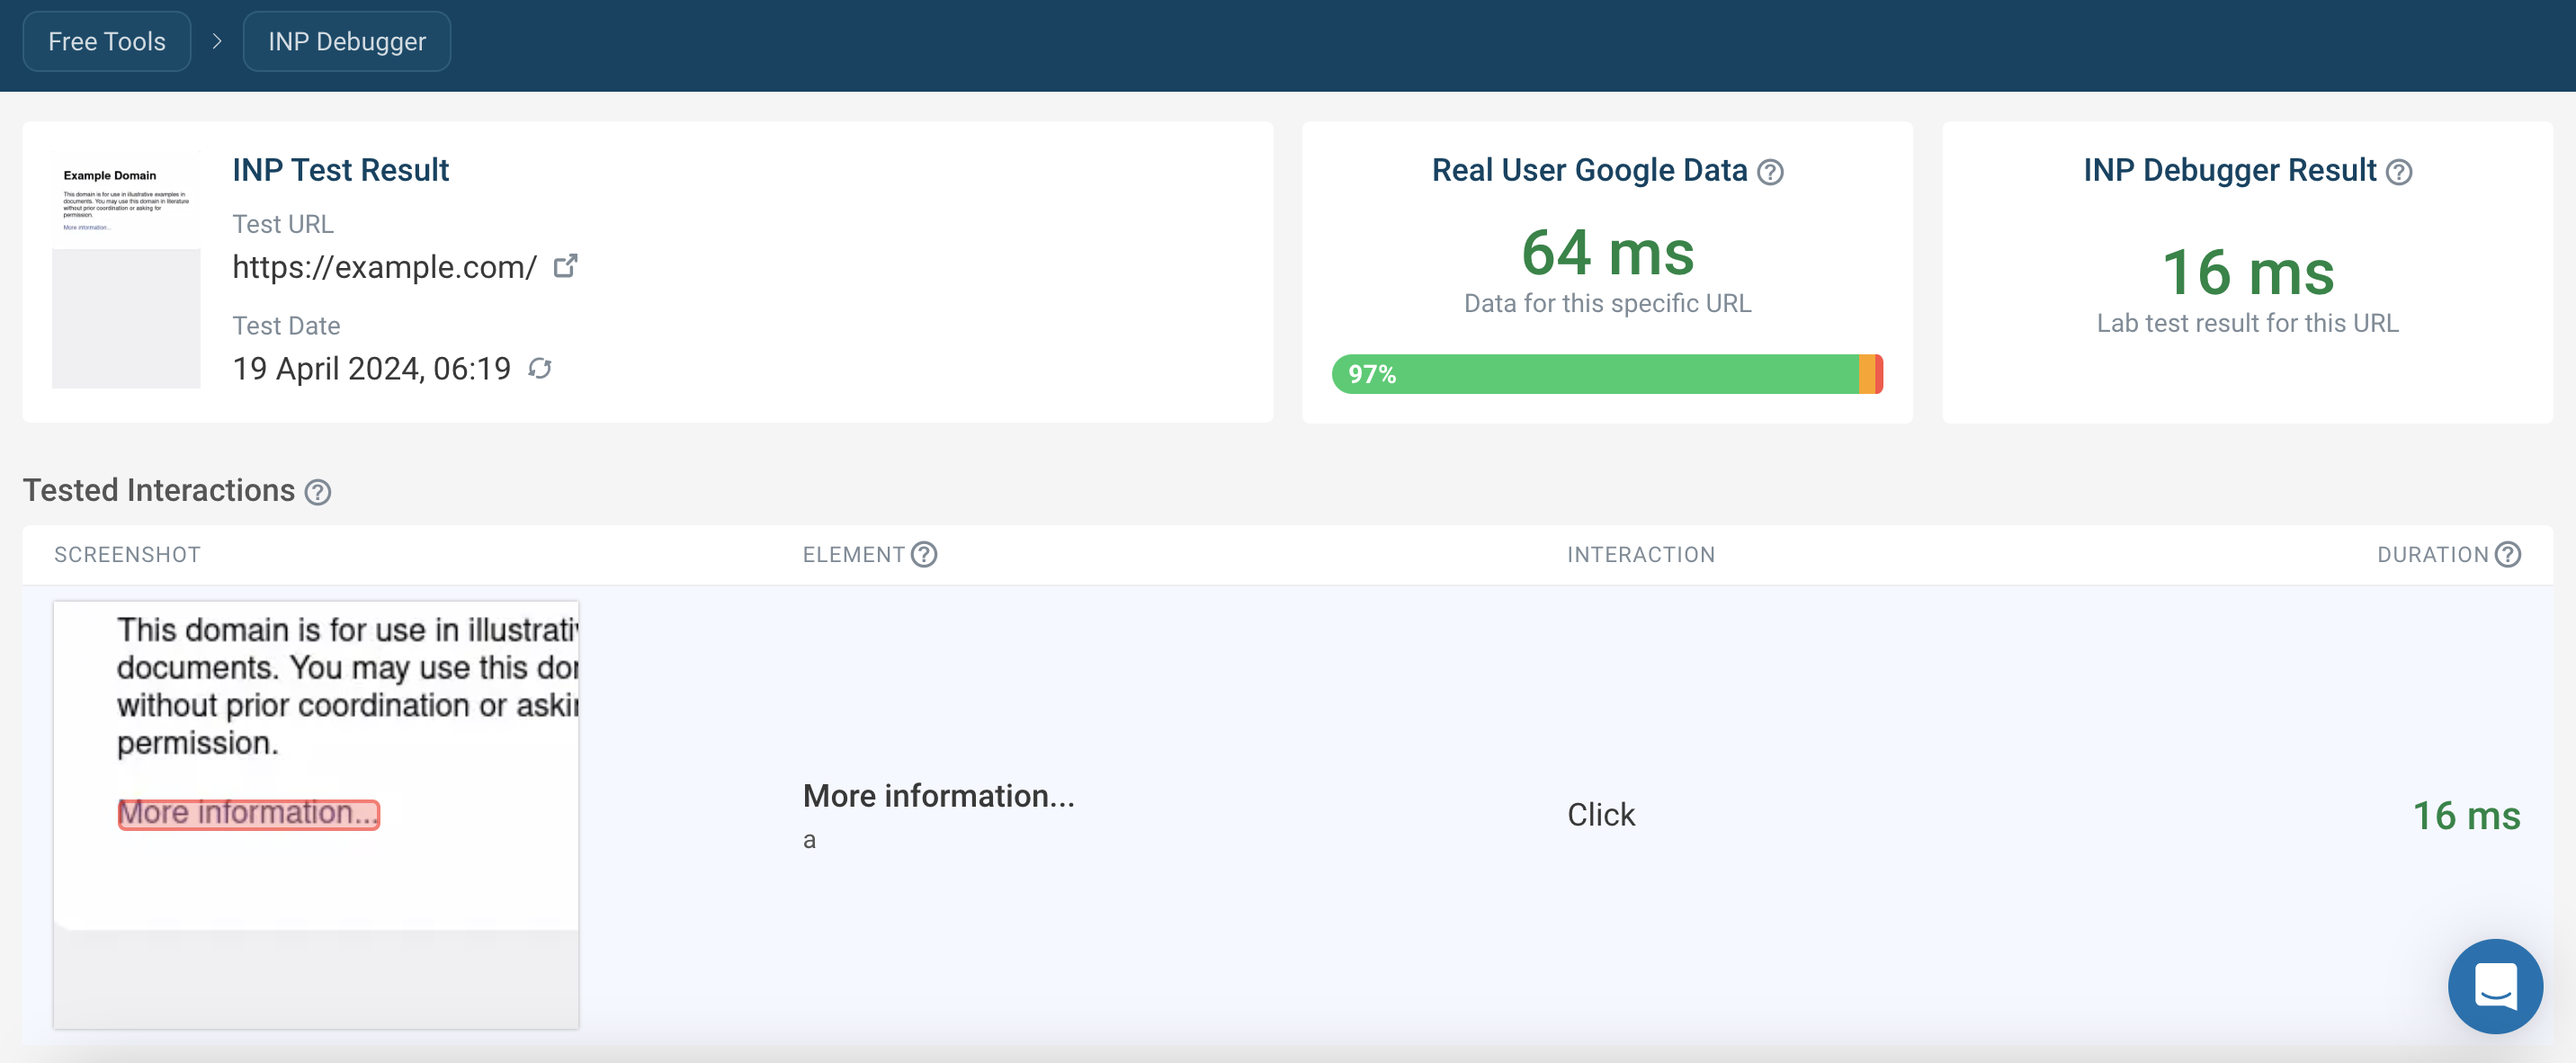
Now, let’s use this tool to test a sample website. Go to the INP debugger website and paste your URL in the field, then click on “Start Test” as follows:
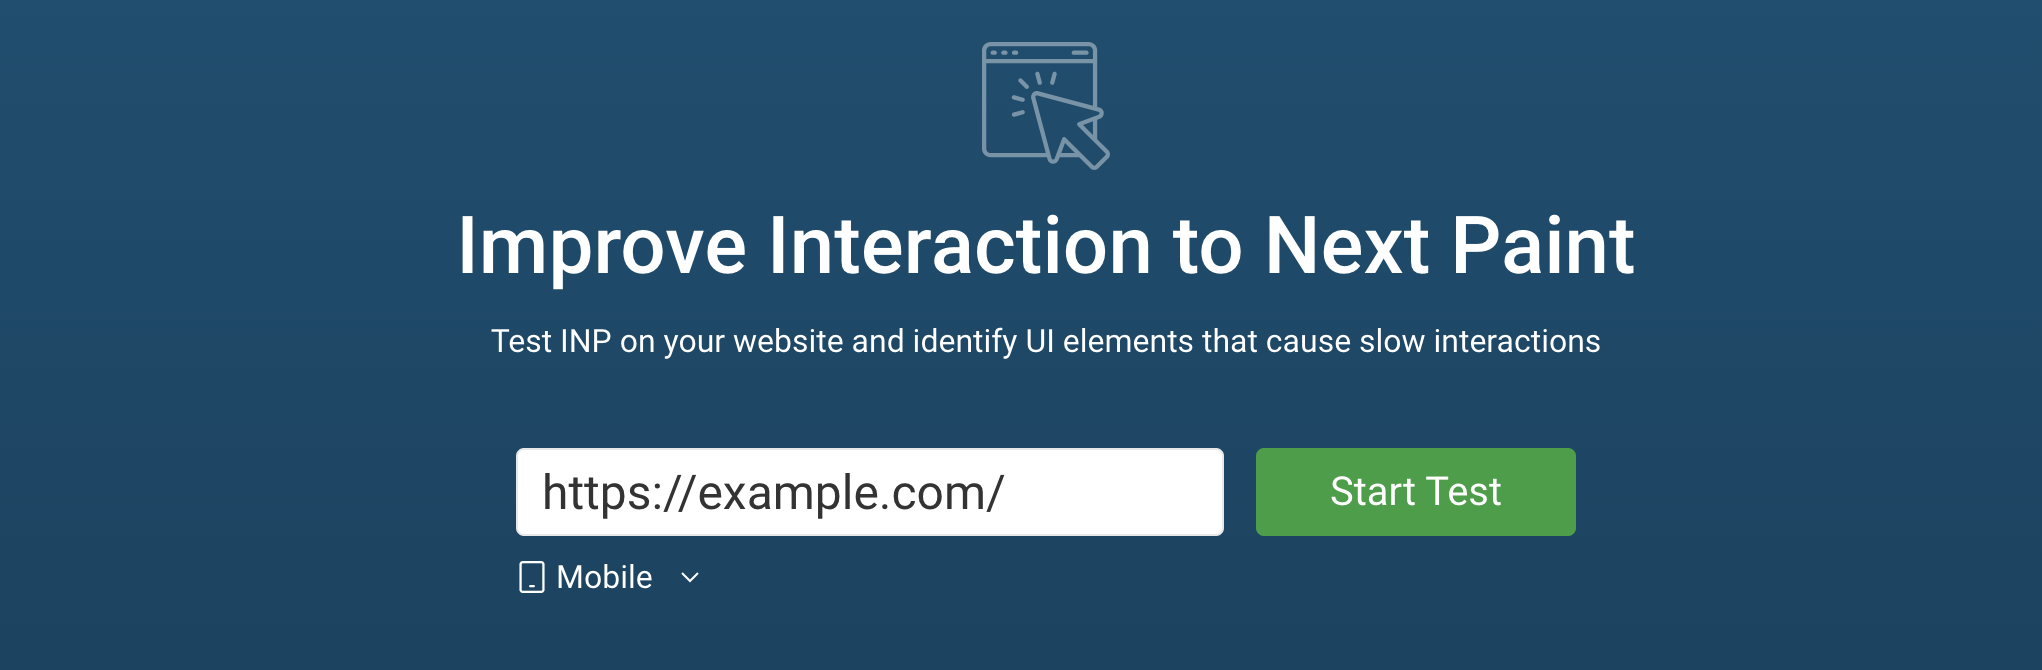
Once you do that, the tool will begin testing your site, and you will see your INP score along with information showing the interactions that were tested:
Web Vitals Chrome Extension
Web Vitals is a Chrome extension that lets you monitor key website performance metrics, including INP. This extension provides a live on-screen display (like a mini dashboard) that shows these metrics directly on your webpage. This visual aid benefits developers or anyone making changes to a webpage, as they can see performance changes in real time.
It pulls data from the CrUX API to give you insights into how real users experience your webpage regarding Core Web Vitals (CWV) metrics. It also displays the current values of these key metrics for the specific webpage you’re currently viewing.
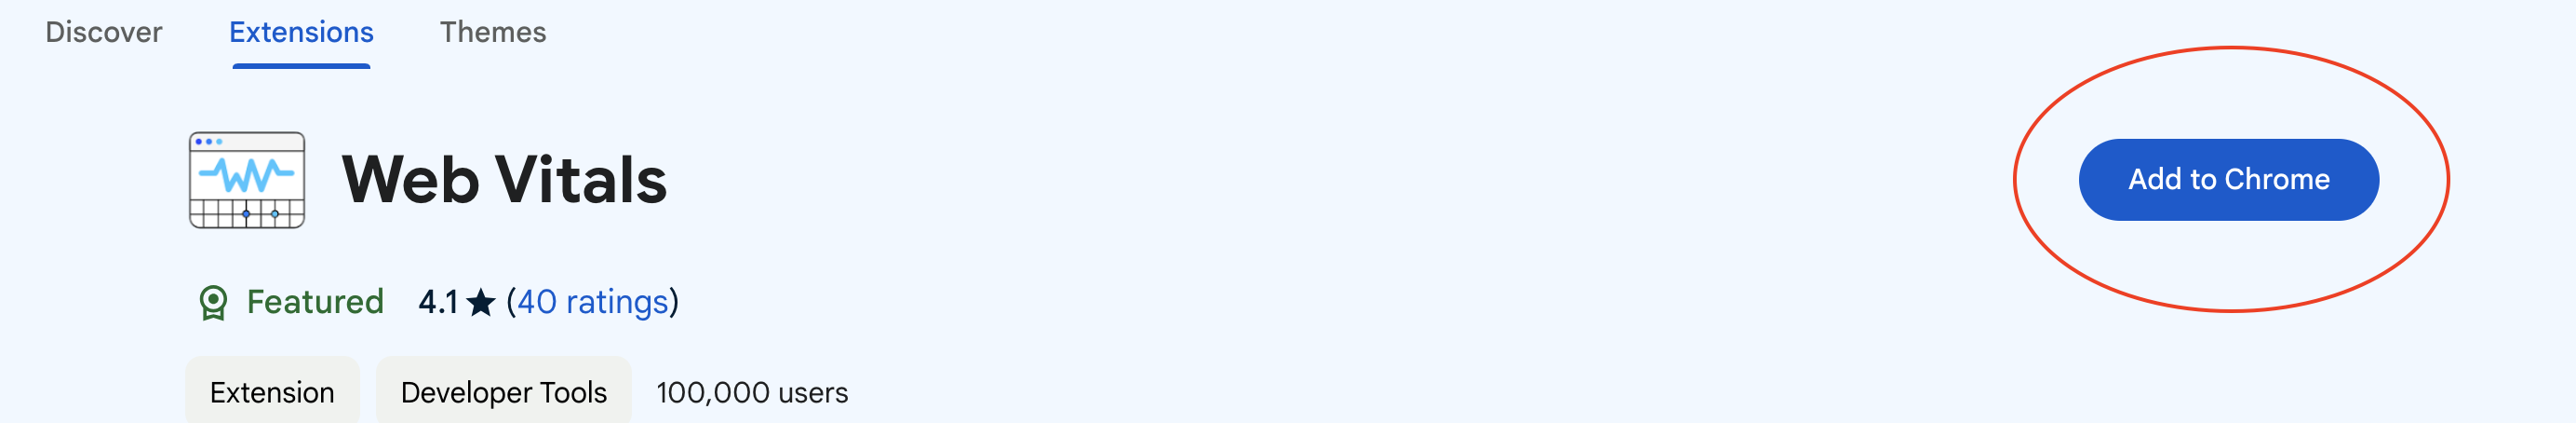
To use this tool, search the extension on Chrome web store and click “Add to Chrome” as shown below:
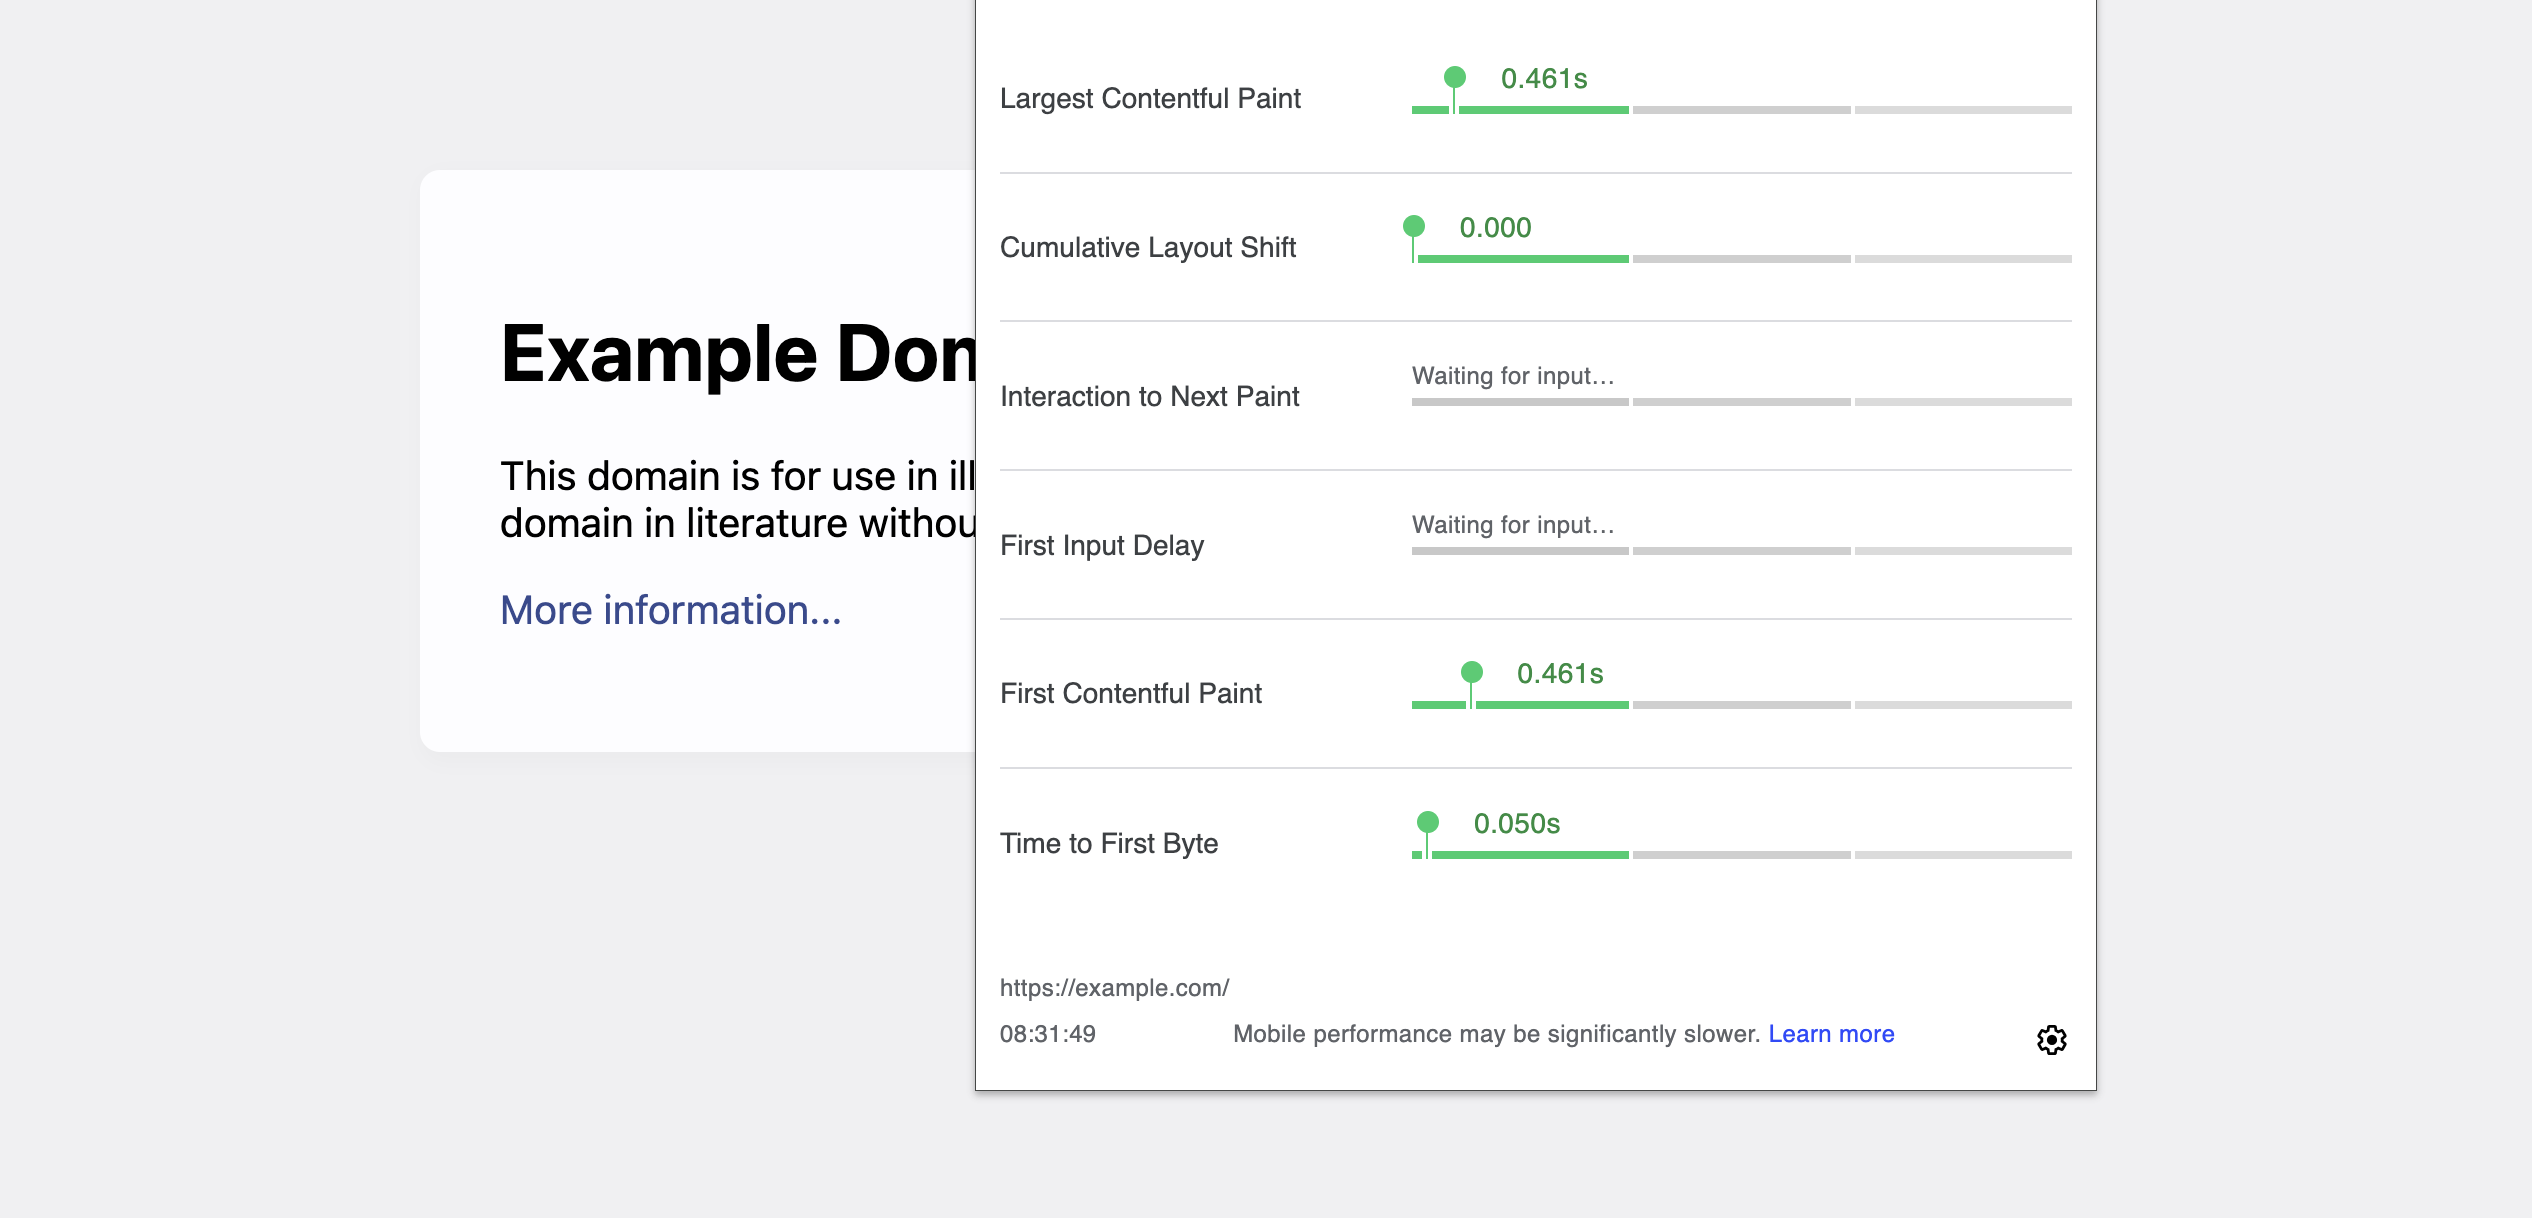
When it’s added, you can now monitor your webpage in real time. For instance, let’s use a sample website and open the extension directly on the page. You will see the following:
Techniques for Optimizing Your Web Experience With INP
Finally, let’s discuss the techniques you can use to optimize your website with INP, enhancing user experience and improving website performance.
Minimizing Main Thread Work
An important step in optimizing INP is minimizing the work done within event callbacks, that is, the code triggered by user actions. You can analyze your callbacks and check if some are unnecessary. Then, if possible, you can remove them completely. For unavoidable callbacks, you can delay non-essential tasks.
Also, long JavaScript tasks can slow down your website. For instance, your website visitors can get overwhelmed by a massive product list on your e-commerce site. Similarly, the main thread gets overloaded when processing large data chunks.
So, to prevent this, you can break down these tasks into smaller and more manageable pieces. You can use techniques like setTimeout and requestIdleCallback to allow the browser process them in smaller bursts, freeing the main thread to handle user interactions and UI updates. This not only improves responsiveness but also avoids visual glitches caused by an overworked main thread.
Another way you can minimize main thread work is by using Web Workers in JavaScript to handle complex tasks without hindering user interaction. They are like assistants that do the heavy lifting in the background. For example, suppose your website has numerous images and videos. In that case, you can leverage Web Workers to process this data in a separate thread, preventing the main thread from overloading and freezing the interface. To use them, you can create two JavaScript files:
main.jsfile for initiating the tasks with the following code:
if (window.Worker) {
  // Create a worker instance
  const backgroundWorker = new Worker('worker.js');
  // Send a message to the worker (replace with actual data)
  backgroundWorker.postMessage({ data: 'Process this data!' });
  // Listen for messages from the worker
  backgroundWorker.onmessage = (e) => {
    console.log('Worker response:', e.data);
 };
} else {
  console.log('Web Workers not available.');
}worker.jsfile that performs the tasks with the following code:
onmessage = (e) => {
  console.log('Received instruction from main script:', e.data);
  // Perform heavy computation or data processing here (replace with actual code)
  // ... (your complex processing logic) ...
  // Then send a message back to the main script
  postMessage('Processing finished, sending results!');
}
Depending on your framework or platform, the specific implementation may vary, but the core concept remains the same: The Web Workers free up the main thread, ensuring a smoother and more responsive user experience, which directly benefits INP.
Reducing JavaScript Execution Time
JavaScript plays a key role in creating interactive web experiences, but it can also impact performance if not managed effectively. Since JavaScript runs on the main thread, which also controls UI updates, inefficient code can slow down the entire webpage. To minimize this impact and improve INP, you can do the following:
-
Reduce File Size: Techniques like minifying JavaScript files and enabling GZip compression can greatly decrease file size. This allows the browser to download and process the code faster, leading to a swifter response to user interactions.
-
Organize and Deliver Efficiently: JavaScript frameworks can help structure your code for faster processing. Additionally, Content Delivery Networks (CDNs) deliver JavaScript files from servers closer to your users, further reducing load times. Together, these strategies ensure your JavaScript executes efficiently without hindering INP.
Minimizing Unnecessary Tasks
Techniques like deferring non-critical JavaScript allow the browser to focus on essential tasks first, ensuring the page remains responsive to user actions. This can involve delaying unnecessary processing until after the initial page load.
Also, techniques like throttling and debouncing help manage how often certain functions execute in response to user interactions. Throttling limits how frequently the function runs (e.g., one per second), while debouncing ensures the function executes only after a set period of user inactivity (e.g., after resizing stops). Both prevent excessive processing that could hinder responsiveness.
Conclusion
Knowing how to optimize INP for your websites is a great investment in user experience. By minimizing delays in the browser’s response to user interactions, you create a website that feels fast and engaging. This leads to better user satisfaction, increased conversions, and potentially improved SEO.
The techniques discussed in this article, from minimizing main thread work to reducing unnecessary tasks, all contribute to a smoother INP. By prioritizing responsiveness, you ensure your website delivers a positive first impression and keeps your users coming back for more!
Gain control over your UX
See how users are using your site as if you were sitting next to them, learn and iterate faster with OpenReplay. — the open-source session replay tool for developers. Self-host it in minutes, and have complete control over your customer data. Check our GitHub repo and join the thousands of developers in our community.